OPEN-SOURCE SCRIPT
Daily Time Theory
Daily Time Theory Indicator
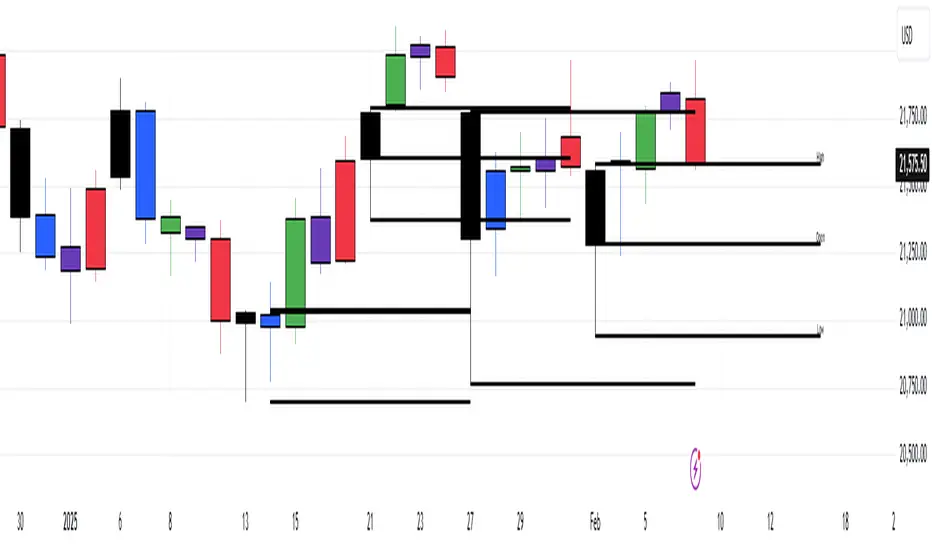
The Daily Time Theory indicator is a versatile tool designed exclusively for daily charts. It dynamically colors daily candles according to the day of the week using customizable colors, making it easy to visually distinguish between Monday through Friday. In addition, it provides the option to display horizontal lines for key price levels (Open, High, Low, and Close) for each day. These lines extend into the future for a user-defined number of weeks, giving traders a clear view of historical support and resistance levels.
Key Features:
Day-Based Candle Coloring:
Each weekday’s candles are automatically colored based on user-defined color settings (e.g. blue for Monday, green for Tuesday, etc.), enhancing chart clarity and enabling quick visual analysis of daily patterns.
Customizable Price Level Lines:
Traders can toggle on or off the display of the Open, High, Low, and Close price levels for each day. This allows you to focus on the specific data points that are most relevant to your trading strategy.
Extended Projections:
The indicator lets you extend the drawn price level lines for multiple weeks. This feature provides insight into historical price levels and helps identify potential support and resistance areas.
Tiny Labels for Clarity:
Each line drawn comes with a small, unobtrusive label at its far right that clearly indicates whether the line represents the Open, High, Low, or Close. This ensures that you always know which price level is being highlighted without cluttering the chart.
User-Friendly Input Grouping:
The inputs are neatly organized into groups by day, making it simple to adjust colors and toggle settings for each weekday independently.
How It Works:
The indicator automatically detects the current day on a daily chart and assigns a corresponding color to the candles.
It stores each day’s Open, High, Low, and Close values using persistent variables so that historical price levels remain visible.
When toggled on, horizontal lines representing the selected price levels are drawn across the chart. A tiny label is attached to the end of each line, indicating the type of price level.
The extended lines allow you to see how historical daily price levels may act as support or resistance in the future.
Usage Recommendations:
This indicator is best used on daily timeframes for markets with regular trading sessions. It is ideal for traders who wish to analyze intra-week price behavior, identify recurring support and resistance levels, and incorporate daily price structure into their trading strategy.
Mã nguồn mở
Theo đúng tinh thần TradingView, tác giả của tập lệnh này đã công bố nó dưới dạng mã nguồn mở, để các nhà giao dịch có thể xem xét và xác minh chức năng. Chúc mừng tác giả! Mặc dù bạn có thể sử dụng miễn phí, hãy nhớ rằng việc công bố lại mã phải tuân theo Nội quy.
Thông báo miễn trừ trách nhiệm
Thông tin và các ấn phẩm này không nhằm mục đích, và không cấu thành, lời khuyên hoặc khuyến nghị về tài chính, đầu tư, giao dịch hay các loại khác do TradingView cung cấp hoặc xác nhận. Đọc thêm tại Điều khoản Sử dụng.