OPEN-SOURCE SCRIPT
Cập nhật Wavechart v2
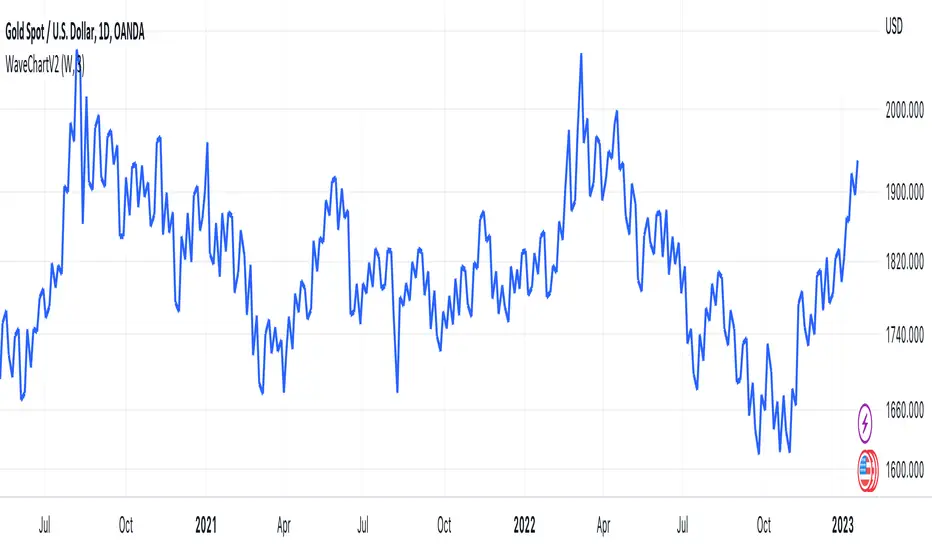
##Wave Chart v2##
For analyzing Neo-wave theory
Plot the market's highs and lows in real-time order.
Then connect the highs and lows
with a diagonal line. Next, the last plot of one day (or bar) is connected with a straight line to the
first plot of the next day (or bar).
For analyzing Neo-wave theory
Plot the market's highs and lows in real-time order.
Then connect the highs and lows
with a diagonal line. Next, the last plot of one day (or bar) is connected with a straight line to the
first plot of the next day (or bar).
Phát hành các Ghi chú
Chang namePhát hành các Ghi chú
- Add line width input - Add Force plot on the last bar
Phát hành các Ghi chú
Add Timeframe DayPhát hành các Ghi chú
In some cases, it may be uncertain whether the high or low value should come first, as both values are derived from the same candlestick. We currently assume it is based on the closing price of the candlestick.
However, there is an option in settings to display an unsure line.
To avoid ambiguity, it is recommended to use multiple timeframes for analysis.
Phát hành các Ghi chú
fix Force plot on the last barPhát hành các Ghi chú
Add more TimeframePhát hành các Ghi chú
fix period divisionPhát hành các Ghi chú
fix bug assume high low time based on closing price of the candlestickPhát hành các Ghi chú
Add Timeframe 240,60,30 Phát hành các Ghi chú
Add timeframe 2W and 2.5YPhát hành các Ghi chú
fix 2.5yearMã nguồn mở
Theo đúng tinh thần TradingView, tác giả của tập lệnh này đã công bố nó dưới dạng mã nguồn mở, để các nhà giao dịch có thể xem xét và xác minh chức năng. Chúc mừng tác giả! Mặc dù bạn có thể sử dụng miễn phí, hãy nhớ rằng việc công bố lại mã phải tuân theo Nội quy.
Thông báo miễn trừ trách nhiệm
Thông tin và các ấn phẩm này không nhằm mục đích, và không cấu thành, lời khuyên hoặc khuyến nghị về tài chính, đầu tư, giao dịch hay các loại khác do TradingView cung cấp hoặc xác nhận. Đọc thêm tại Điều khoản Sử dụng.
Mã nguồn mở
Theo đúng tinh thần TradingView, tác giả của tập lệnh này đã công bố nó dưới dạng mã nguồn mở, để các nhà giao dịch có thể xem xét và xác minh chức năng. Chúc mừng tác giả! Mặc dù bạn có thể sử dụng miễn phí, hãy nhớ rằng việc công bố lại mã phải tuân theo Nội quy.
Thông báo miễn trừ trách nhiệm
Thông tin và các ấn phẩm này không nhằm mục đích, và không cấu thành, lời khuyên hoặc khuyến nghị về tài chính, đầu tư, giao dịch hay các loại khác do TradingView cung cấp hoặc xác nhận. Đọc thêm tại Điều khoản Sử dụng.