OPEN-SOURCE SCRIPT
Moving Averages Trend Indicator
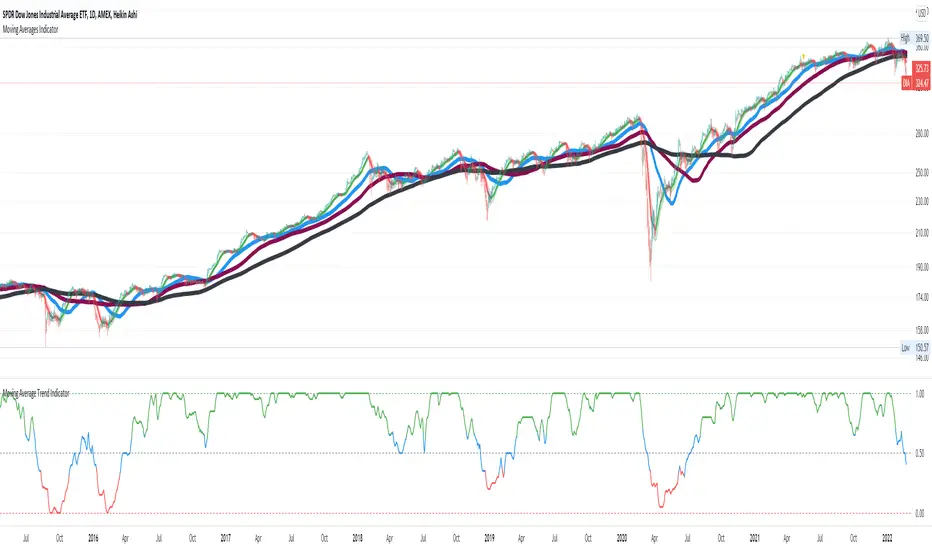
Computes a metric (0.0-1.0) based on the relative (above/below) relationship of price (close) and the moving averages of WMA0 (20day), SMA1 (50day), SMA2 (100day), SMA3 (200day).
Metric = 1.0 when price > SMA0 > SMA1 > SMA2 > SMA3
Metric = 0.0 when price < SMA0 < SMA1 < SMA2 < SMA3
This metric helps you track the price "trend." Color of the metric helps you track if the price is a bullish (green) or bearish (red). Blue indicates neutral.
Settings:
- Time Frame is adjustable
- SMA lengths are adjustable
- Threshold for bullish/bearish is adjustable
Mã nguồn mở
Theo đúng tinh thần TradingView, tác giả của tập lệnh này đã công bố nó dưới dạng mã nguồn mở, để các nhà giao dịch có thể xem xét và xác minh chức năng. Chúc mừng tác giả! Mặc dù bạn có thể sử dụng miễn phí, hãy nhớ rằng việc công bố lại mã phải tuân theo Nội quy.
Thông báo miễn trừ trách nhiệm
Thông tin và các ấn phẩm này không nhằm mục đích, và không cấu thành, lời khuyên hoặc khuyến nghị về tài chính, đầu tư, giao dịch hay các loại khác do TradingView cung cấp hoặc xác nhận. Đọc thêm tại Điều khoản Sử dụng.