OPEN-SOURCE SCRIPT
RSI - colour fill
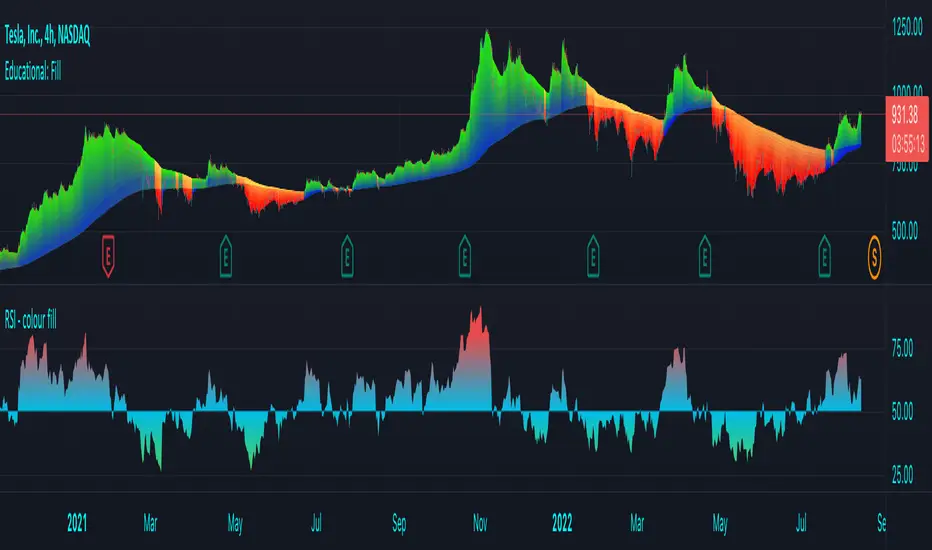
This script showcases the new (overload) feature regarding the fill() function! 🥳
2 plots could be filled before, but with just 1 colour per bar, now the colour can be a gradient type.
In this example we have 2 plots
- rsiPlot , which plots the rsi value
- centerPlot, which plots the value 50 ('centre line')
Explanation of colour fill in the zone 50-80
Default when rsi > 50
- a bottom value is set at 50 (associated with colour aqua)
- and a top value is set at 80 (associated with colour red)
This zone (bottom -> top value) is filled with a gradient colour (50 - aqua -> 80 - red)
When rsi is towards 80, you see a red coloured zone at the rsi value,
while when rsi is around 50, you'll only see the colour aqua
The same principle is applied in the zone 20-50 when rsi < 50
Cheers!
Mã nguồn mở
Theo đúng tinh thần TradingView, tác giả của tập lệnh này đã công bố nó dưới dạng mã nguồn mở, để các nhà giao dịch có thể xem xét và xác minh chức năng. Chúc mừng tác giả! Mặc dù bạn có thể sử dụng miễn phí, hãy nhớ rằng việc công bố lại mã phải tuân theo Nội quy.
Who are PineCoders?
tradingview.com/chart/SSP/yW5eOqtm-Who-are-PineCoders/
TG Pine Script® Q&A: t.me/PineCodersQA
- We cannot control our emotions,
but we can control our keyboard -
tradingview.com/chart/SSP/yW5eOqtm-Who-are-PineCoders/
TG Pine Script® Q&A: t.me/PineCodersQA
- We cannot control our emotions,
but we can control our keyboard -
Thông báo miễn trừ trách nhiệm
Thông tin và các ấn phẩm này không nhằm mục đích, và không cấu thành, lời khuyên hoặc khuyến nghị về tài chính, đầu tư, giao dịch hay các loại khác do TradingView cung cấp hoặc xác nhận. Đọc thêm tại Điều khoản Sử dụng.