OPEN-SOURCE SCRIPT
Dynamic Trend Lines-AYNET
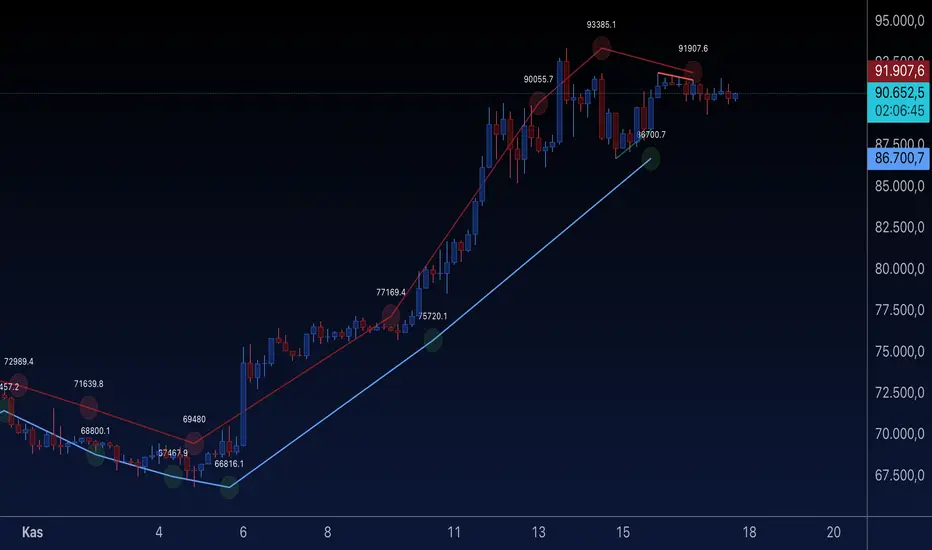
Code Summary: Dynamic Trend Lines
This code dynamically draws trend lines and labels based on swing highs and lows identified from historical price action.
Key Features
Swing Point Detection:
Uses the ta.pivothigh and ta.pivotlow functions to identify recent swing highs and swing lows based on a customizable lookback period.
Trend Lines:
Uptrend Line:
Draws a line connecting swing low points.
Colored in blue by default.
Downtrend Line:
Draws a line connecting swing high points.
Colored in red by default.
Lines dynamically adjust as new swing points are identified.
Labels:
Adds a circle-style label at each swing high and swing low.
Displays the price value of the swing point.
Labels have:
Green background for uptrends.
Red background for downtrends.
Customizable Inputs:
lookback: Sensitivity of swing point detection (higher value = fewer swings).
line_color_up and line_color_down: Colors for the trend lines.
label_bg_up and label_bg_down: Colors for the label backgrounds.
Auto Updates:
Trend lines and labels update dynamically as the chart progresses, ensuring they reflect the latest market conditions.
How It Works
Identify Swing Points:
Detects local highs and lows within the defined lookback period.
Draw Lines:
Uptrend lines are drawn from the most recent swing lows.
Downtrend lines are drawn from the most recent swing highs.
Add Labels:
Each swing point is labeled with its price value for easy reference.
Visual Output
Trend Lines:
Blue for uptrends, red for downtrends.
Labels:
Circular labels with price values:
Green for swing lows (uptrend points).
Red for swing highs (downtrend points).
Example Use Case
This script is useful for traders who want to:
Visually identify key trend lines based on swing highs and lows.
Understand the critical price points of market reversals.
Use labeled price points for informed trade decisions.
Let me know if you'd like any specific refinements! 😊
Mã nguồn mở
Theo đúng tinh thần TradingView, tác giả của tập lệnh này đã công bố nó dưới dạng mã nguồn mở, để các nhà giao dịch có thể xem xét và xác minh chức năng. Chúc mừng tác giả! Mặc dù bạn có thể sử dụng miễn phí, hãy nhớ rằng việc công bố lại mã phải tuân theo Nội quy.
Thông báo miễn trừ trách nhiệm
Thông tin và các ấn phẩm này không nhằm mục đích, và không cấu thành, lời khuyên hoặc khuyến nghị về tài chính, đầu tư, giao dịch hay các loại khác do TradingView cung cấp hoặc xác nhận. Đọc thêm tại Điều khoản Sử dụng.