OPEN-SOURCE SCRIPT
Hancock - Floating O/B O/S IFT RSI T3MA
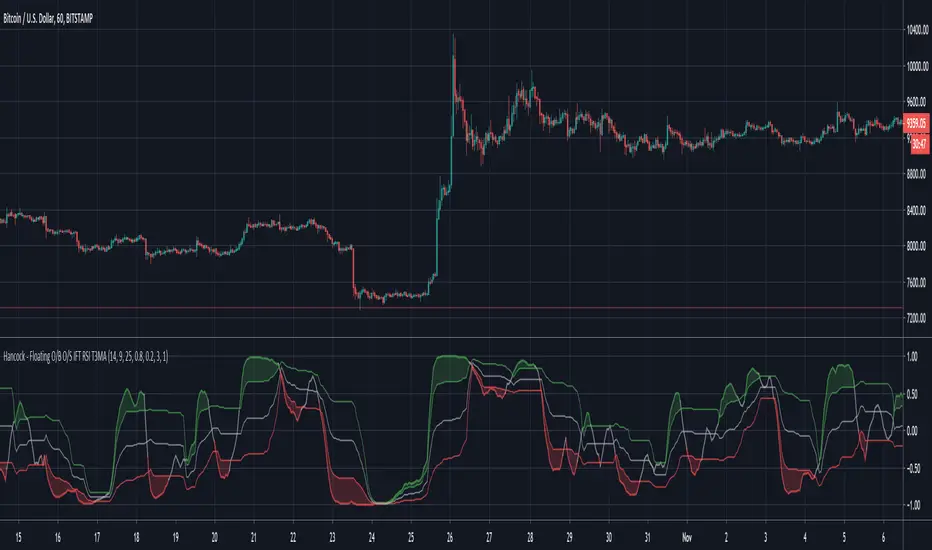
This is a version of the Inverse Fisher Transform Relative Strength Index with floating oversold and overbought thresholds.
Configurable parameters:
RSI length - This is the period used for the RSI .
RSI Smooth Length - This is the smoothing period of the Weighted Moving Average used for the smoothing in Inverse Fisher Transform .
RSI Threshold Period - This is the period used for calculating the floating oversold and overbought thresholds.
RSI Overbought - Configures the overbought threshold (80% default).
RSI Oversold - Configures the oversold threshold (20% default).
T3 Smoothing - Enabling this applies T3MA smoothing to the RSI.
T3 Length - This is the period used for the T3MA smoothing of the RSI.
T3 Factor - This is the factor used for the T3MA smoothing of the RSI.
RSI line breaching the thresholds are clearly indicated by filled chart plots.
An inverse Fisher transform of RSI is designed to enhance the extremes (overbought and oversold zones), in combination with floating thresholds this version allows faster and cleaner trend detection and identification. With additional smoothing, false signals can be avoided. As with any other indicator some experimenting with parameters is advised (in order to find optimal settings for symbol/time frame pair).
Happy trading folks!
Hancock
Mã nguồn mở
Theo đúng tinh thần TradingView, tác giả của tập lệnh này đã công bố nó dưới dạng mã nguồn mở, để các nhà giao dịch có thể xem xét và xác minh chức năng. Chúc mừng tác giả! Mặc dù bạn có thể sử dụng miễn phí, hãy nhớ rằng việc công bố lại mã phải tuân theo Nội quy.
Thông báo miễn trừ trách nhiệm
Thông tin và các ấn phẩm này không nhằm mục đích, và không cấu thành, lời khuyên hoặc khuyến nghị về tài chính, đầu tư, giao dịch hay các loại khác do TradingView cung cấp hoặc xác nhận. Đọc thêm tại Điều khoản Sử dụng.