OPEN-SOURCE SCRIPT
Cập nhật Earnings X-Ray
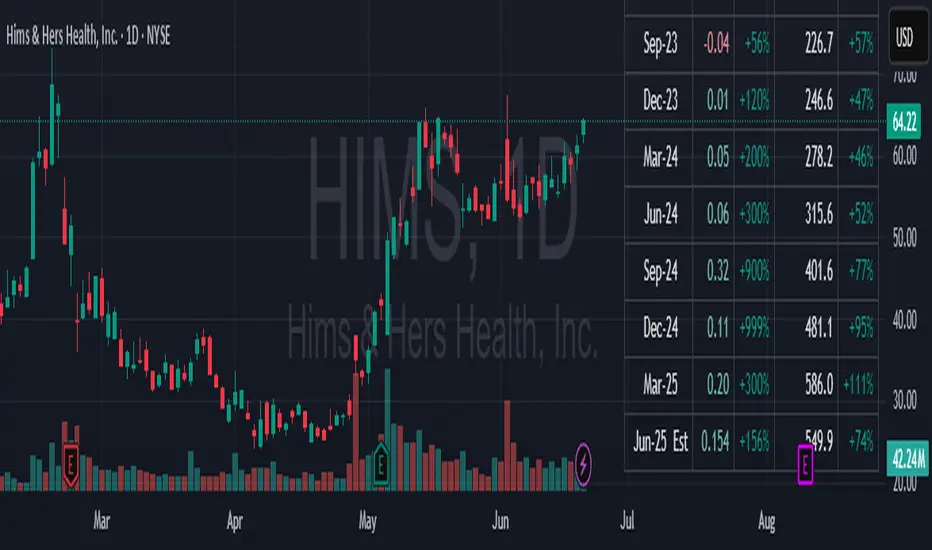
The script presents earnings and revenues in a tabular format. Particularly, it calculates percentage changes.
Earnings data can be found in TradingView Financials. However, percentage changes are not provided. Can TradingView implement this in the future?
Displaying earnings table on the chart has its benefits. No additional clicks required to access the data. This significantly streamlines the stock scanning process.
It is important to quickly evaluate a company's earnings when scanning for stocks. The script provides this capability.
Similar scripts have been created previously. This script corrects calculations and improves presentation with the concise code.
Data access:
Earnings = request.earnings(syminfo.tickerid, earnings.actual)
FutureEarnings = earnings.future_eps
FutureRevenue = earnings.future_revenue
Can more than one quarter of future earnings estimates become available in Pine Script in the future?
The script was validated against MarketSurge.
Features:
- Quarterly or Yearly data
- Configurable number of fiscal periods
- Configurable location on the chart
- Optional Dark mode
Phát hành các Ghi chú
Bug fixes. Dark mode is now automatic. Optional color the for EPS column.Phát hành các Ghi chú
Converted to Pine Script v6.Added Transparency setting.
Handled edge case for missing revenue value just after earnings release.
Phát hành các Ghi chú
Minor bug fix.Phát hành các Ghi chú
Update the chartMã nguồn mở
Theo đúng tinh thần TradingView, tác giả của tập lệnh này đã công bố nó dưới dạng mã nguồn mở, để các nhà giao dịch có thể xem xét và xác minh chức năng. Chúc mừng tác giả! Mặc dù bạn có thể sử dụng miễn phí, hãy nhớ rằng việc công bố lại mã phải tuân theo Nội quy.
Thông báo miễn trừ trách nhiệm
Thông tin và các ấn phẩm này không nhằm mục đích, và không cấu thành, lời khuyên hoặc khuyến nghị về tài chính, đầu tư, giao dịch hay các loại khác do TradingView cung cấp hoặc xác nhận. Đọc thêm tại Điều khoản Sử dụng.
Mã nguồn mở
Theo đúng tinh thần TradingView, tác giả của tập lệnh này đã công bố nó dưới dạng mã nguồn mở, để các nhà giao dịch có thể xem xét và xác minh chức năng. Chúc mừng tác giả! Mặc dù bạn có thể sử dụng miễn phí, hãy nhớ rằng việc công bố lại mã phải tuân theo Nội quy.
Thông báo miễn trừ trách nhiệm
Thông tin và các ấn phẩm này không nhằm mục đích, và không cấu thành, lời khuyên hoặc khuyến nghị về tài chính, đầu tư, giao dịch hay các loại khác do TradingView cung cấp hoặc xác nhận. Đọc thêm tại Điều khoản Sử dụng.