Multi-Timeframe Trend Analysis [LevelUp]
Identifying Trends and Box Types
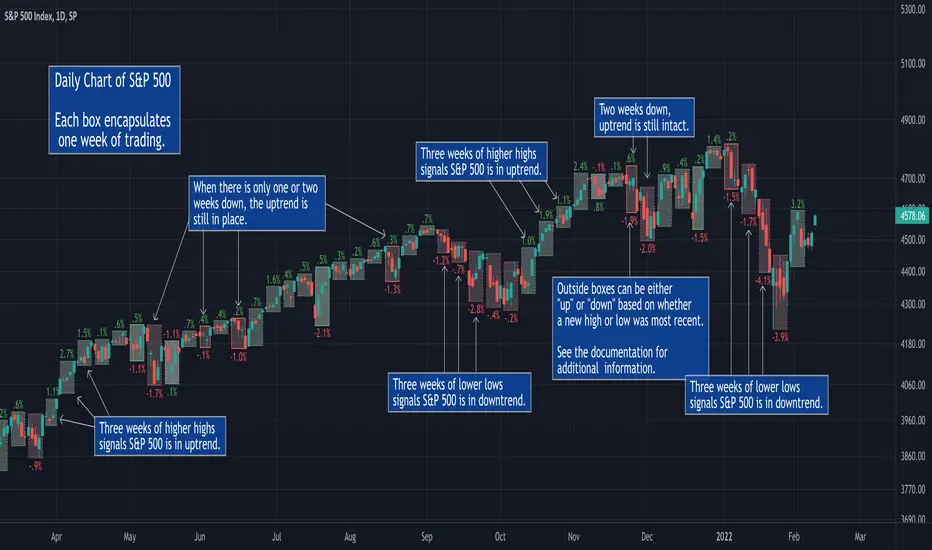
It's easy to get caught up with the noise of tracking price movement, bar by bar. This is even more relevant on lower timeframes. When performing trend analysis, it can be very helpful to step back and look at the bigger picture.
To help facilitate visualizing trends, with this indicator you can view higher timeframe data without changing to a new chart:
■ View the weekly trend from a daily chart.
■ View the monthly trend from a weekly chart.
■ View the quarterly trend from a monthly chart.
The weekly chart of GOOGL is shown below. Each box encapsulates one month of trading activity. You can also see the four types of boxes that may be shown: up, down, inside and outside.
Up Box - When a box highest high is above the previous box high, it is considered an up box. The percent change shows the increase from the previous box highest high to the highest high of the current box.
Down Box - When a box lowest low is below the previous box lowest low, it is considered a down box. The percent change shows the decrease from the previous box lowest low to the lowest low of the current box.
Inside Box - When a box highest high is below the previous box highest high, and the box lowest low is greater than the previous box lowest low, it is considered an inside box. Two percent changes are shown. One indicating the decrease from previous box highest high to the highest high of the current box. The other indicating the increase from the previous box lowest low to the lowest low of the current box.
Outside Box - When a box highest high is above the previous box highest high, and the box lowest low is below the previous box lowest low, it is considered an outside box. Two percent changes are shown. One indicating the increase from previous box highest high to the highest high of the current box. The other indicating the decrease from the previous box lowest low to the lowest low of the current box.
Special Note for Outside Boxes: As far as outside boxes and whether they are continuing or changing the trend, it depends on the action of the most recent high or low. The box is considered to be an up box if the highest high is more recent than the lowest low, and vice versa.
How to Use the Indicator
The goal of this indicator is to help spot changes in the trend. Historical price data has shown that movements up/down often occur in threes. By looking for boxes encapsulating higher timeframe moves, we can see when a trend may be changing.
Three Higher Highs - If price movement is sideways or down and is followed by three consecutive higher highs, this may be the start of an uptrend.
Three Lower Lows - If price movement is sideways or up and is followed by three consecutive lower lows, this may be the start of a downtrend.
Percent Change Information
Each box has an optional percent (%) change value. Refer to the image and description below for more information.
Additional Examples
Features
■ View price action trends of higher timeframes without changing the chart timeframe.
■ View percent gain/loss from one box to another.
■ Customize box border and background colors.
■ Show/hide percent change values.
■ Add support for Futures and Forex.
■ Minor updates to Settings.
Tập lệnh chỉ hiển thị cho người được mời
Chỉ những người dùng được tác giả chấp thuận mới có thể truy cập tập lệnh này. Bạn sẽ cần yêu cầu và được cấp quyền sử dụng. Thông thường quyền này được cấp sau khi thanh toán. Để biết thêm chi tiết, làm theo hướng dẫn của tác giả bên dưới hoặc liên hệ trực tiếp với LevelUpTools.
TradingView KHÔNG khuyến nghị bạn trả phí hoặc sử dụng một tập lệnh trừ khi bạn hoàn toàn tin tưởng vào tác giả và hiểu cách hoạt động của tập lệnh. Bạn cũng có thể tìm các lựa chọn miễn phí, mã nguồn mở trong các script cộng đồng của chúng tôi.
Hướng dẫn của tác giả
tradingview.com/spaces/LevelUpTools/
Thông báo miễn trừ trách nhiệm
Tập lệnh chỉ hiển thị cho người được mời
Chỉ những người dùng được tác giả chấp thuận mới có thể truy cập tập lệnh này. Bạn sẽ cần yêu cầu và được cấp quyền sử dụng. Thông thường quyền này được cấp sau khi thanh toán. Để biết thêm chi tiết, làm theo hướng dẫn của tác giả bên dưới hoặc liên hệ trực tiếp với LevelUpTools.
TradingView KHÔNG khuyến nghị bạn trả phí hoặc sử dụng một tập lệnh trừ khi bạn hoàn toàn tin tưởng vào tác giả và hiểu cách hoạt động của tập lệnh. Bạn cũng có thể tìm các lựa chọn miễn phí, mã nguồn mở trong các script cộng đồng của chúng tôi.
Hướng dẫn của tác giả
tradingview.com/spaces/LevelUpTools/