OPEN-SOURCE SCRIPT
Cập nhật Wave Trend -V2
Wave Trend -V2 is here to give you a serious edge.
This upgraded version of the popular LazyBear script takes wave trend analysis to the next level.
Here's the deal:
Multi-Timeframe Analysis: Beyond Short-Term Noise:
Novice traders often focus solely on the current timeframe (let's say, the 5-minute chart).
Wave Trend -V2 breaks free from this limitation by analyzing price action across multiple timeframes (1-minute to 1-week).
---This holistic view helps you:
Identify larger trends: Are we in a bullish uptrend on the daily chart, even if the hourly chart is showing some short-term weakness? Wave Trend -V2 helps you see the bigger picture.
Avoid false breakouts: Short-term price spikes can create false signals. By looking at higher timeframes, you can filter out these "noise" and focus on sustainable trends.
---Pressure Analysis: Gauging Market Strength:
Wave Trend -V2 goes beyond simple trend identification.
It incorporates "pressure" analysis to gauge the strength and direction of the current market trend.
This helps you:
Enter trades with confidence: When the trend is strong and the pressure is high, you can enter trades with greater conviction.
Minimize risk: If the pressure is waning or conflicting signals arise, you can avoid entering trades or adjust your risk parameters accordingly.
Impact Point Analysis: Predicting Future Price Moves:
Wave Trend -V2 analyzes the price impact of the last four wave trend crossovers.
Let's say the last impact point was "X", the previous one "X-1", the one before that "X-2", and so on.
The indicator calculates the average price movement between these points using the following simplified formula:
Average Impact = (X - X-1) + (X-1 - X-2) + (X-2 - X-3) / 3
This average provides a valuable estimate of the potential price movement of the next crossover.
Multiple Take Profit Levels: Setting Strategic Targets:
Wave Trend -V2 offers three dynamic take profit levels (TP1, TP2, TP3).
TP1: Based on the estimated average impact.
TP2: Twice the estimated average impact.
TP3: Three times the estimated average impact.
This allows you to set your profit targets strategically, maximizing potential gains while managing risk effectively.
Why don't use the Estmated impact point to stop the trade?
In order to eliminated the WHIPSAW effect! There is no other way...
Wave Trend -V2 is designed for traders who seek a deeper understanding of trend dynamics and desire a more sophisticated approach to trading. By combining multi-timeframe analysis, pressure assessment, and advanced impact point calculations, this indicator empowers you to make more informed trading decisions and potentially improve your trading outcomes.
The indicator work best with combination of other trend type indicators.
Please dont forget that indicators are not miracle medicines , it cannot give you exact results , market was always volative , use at your own discretion.
Phát hành các Ghi chú
table size and graphic is updated, everything else is the samePhát hành các Ghi chú
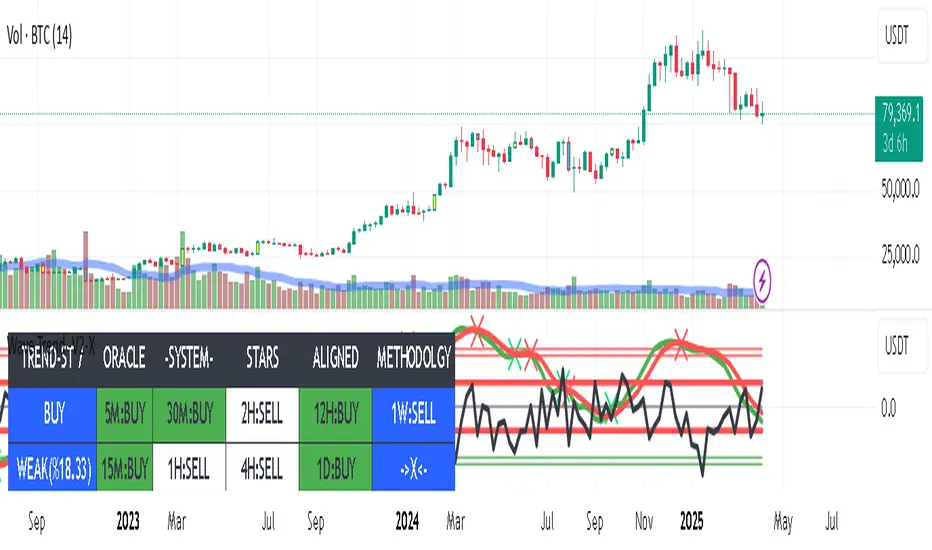
1 Minute detail was removed , if you want to acces it select the 1m timeline chart.Overall Trend Direction Strength Calculation (Using Weighted Points) was added in the script.
Every x timeline was weighted with a numerical factor.
Example Trend Direction Strength calculation:
15M (1 point) - Downtrend → -1
1H (2 points) - Uptrend (mid/end) → +2
4H (3 points) - Crossing Uptrend (oversold) → +3
1D (4 points) - Downtrend (near oversold) → -4
1W (5 points) - Downtrend (approaching neutral) → -5
Total Weighted Points:
-1 + 2 + 3 - 4 - 5 = -5
--------------
0~5 = Weak Trend
5~10 = Mid Trend
15 = High Trend
--------------
İf the sum of these focused points is negative general trend is downwards and first box indicate SELL vice verse is upwards and box shows BUY.
I also added a plot on the indicators wt1 and wt2 lines, if was a visual feedback.
MY suggestion is don't enter a trade if the "Trend Direction Strength" is on the other side.
Example ;
İf Trend Direction Strength = Sell -10 then Seek for SELL type cross on wave trend.
İf Trend Direction Strength = Buy +15 then Seek for BUY type cross on wave trend.
Good luckc guys.
Phát hành các Ghi chú
we made some updates ,First of all more timelines was added in scripts.
The trend strength calculation was updated with bias of power levels.
Example 5M timeline;
////////////
BuyStrength5M =
out5MX > 25 ? 0.25 :
out5MX > 0 ? 0.50 :
out5MX > -25 ? 0.75 :
1.0 // Default strongest buy
sellStrength5M =
out5MX < -25 ? -0.25 :
out5MX < 0 ? -0.50 :
out5MX < 25 ? -0.75 :
-1.0 // Default strongest sell
////////////
we know that this was not a %100 correct solution and need refinement therefore we really appreciate if you check the script and give us your feedback.
We will work for table size and position on next iterations.
/////
Meanwhile i wanted to give my personal thanks for Suhulo for his booster idea and application on trend strength calculation.
Good luck guys.
Phát hành các Ghi chú
Hello guys , There are some bug fixes , updates are made in trend strength section , also after some testing the tp & stop levels are updated , please feel free to use and give us your feedbacks.
Thank you in advance.
Mã nguồn mở
Theo đúng tinh thần TradingView, tác giả của tập lệnh này đã công bố nó dưới dạng mã nguồn mở, để các nhà giao dịch có thể xem xét và xác minh chức năng. Chúc mừng tác giả! Mặc dù bạn có thể sử dụng miễn phí, hãy nhớ rằng việc công bố lại mã phải tuân theo Nội quy.
Thông báo miễn trừ trách nhiệm
Thông tin và các ấn phẩm này không nhằm mục đích, và không cấu thành, lời khuyên hoặc khuyến nghị về tài chính, đầu tư, giao dịch hay các loại khác do TradingView cung cấp hoặc xác nhận. Đọc thêm tại Điều khoản Sử dụng.