OPEN-SOURCE SCRIPT
Power Zone Trader (PZT)
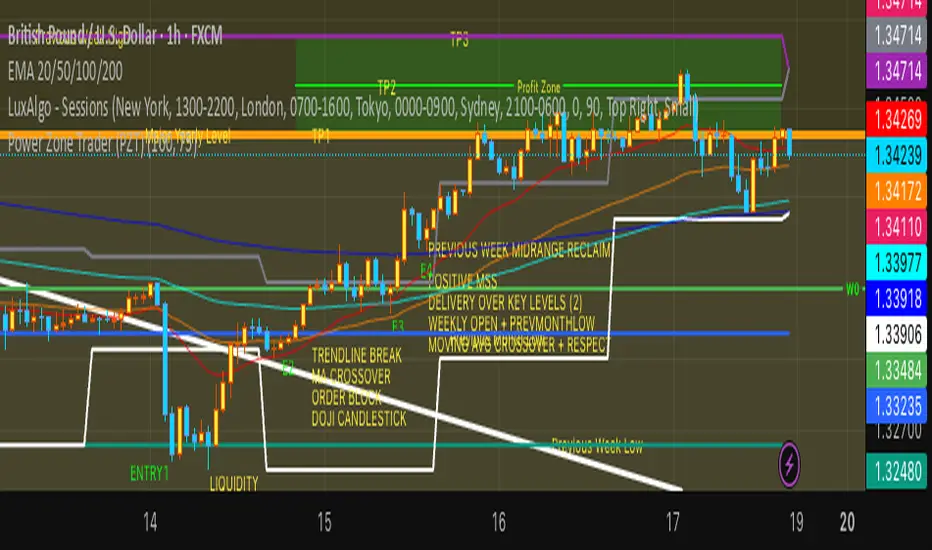
The PZT Indicator (Power Zone Trader ) is a multi-timeframe confluence system designed to identify and visualize natural support and resistance levels with exceptional clarity. By automatically mapping key structural highs and lows from higher timeframes, PZT allows traders to see where price is most likely to react, reverse, or accelerate, forming the foundation for high-probability trade setups. PZT highlights key reaction zones that influence order flow and trader behavior across all markets — including Forex, Crypto, Indices, and Commodities.
📍 Indicator Key
Each color represents a significant price level derived from its respective timeframe, helping traders instantly gauge market context and potential liquidity pools:
Color Level Represented Significance
🔴 Red Yearly High Strong resistance — potential selling pressure and major liquidity sweep zones.
🟢 Green Yearly Low Strong support — potential buying interest and accumulation points.
🟠 Orange Monthly High Intermediate resistance — swing rejection or continuation decision zone.
🔵 Blue Monthly Low Intermediate support — potential retracement or base-building area.
🟣 Purple Weekly High Short-term resistance — common rejection level or stop hunt zone.
🟤 Teal Weekly Low Short-term support — potential rebound or liquidity grab.
⚫ Gray Daily High Intraday resistance — active scalper and day trader interest.
⚪ White Daily Low Intraday support — short-term bounce or continuation pivot.
Mã nguồn mở
Theo đúng tinh thần TradingView, người tạo ra tập lệnh này đã biến tập lệnh thành mã nguồn mở để các nhà giao dịch có thể xem xét và xác minh công năng. Xin dành lời khen tặng cho tác giả! Mặc dù bạn có thể sử dụng miễn phí, nhưng lưu ý nếu đăng lại mã, bạn phải tuân theo Quy tắc nội bộ của chúng tôi.
Thông báo miễn trừ trách nhiệm
Thông tin và ấn phẩm không có nghĩa là và không cấu thành, tài chính, đầu tư, kinh doanh, hoặc các loại lời khuyên hoặc khuyến nghị khác được cung cấp hoặc xác nhận bởi TradingView. Đọc thêm trong Điều khoản sử dụng.