OPEN-SOURCE SCRIPT
Cập nhật Daily Moving Averages Oscillator
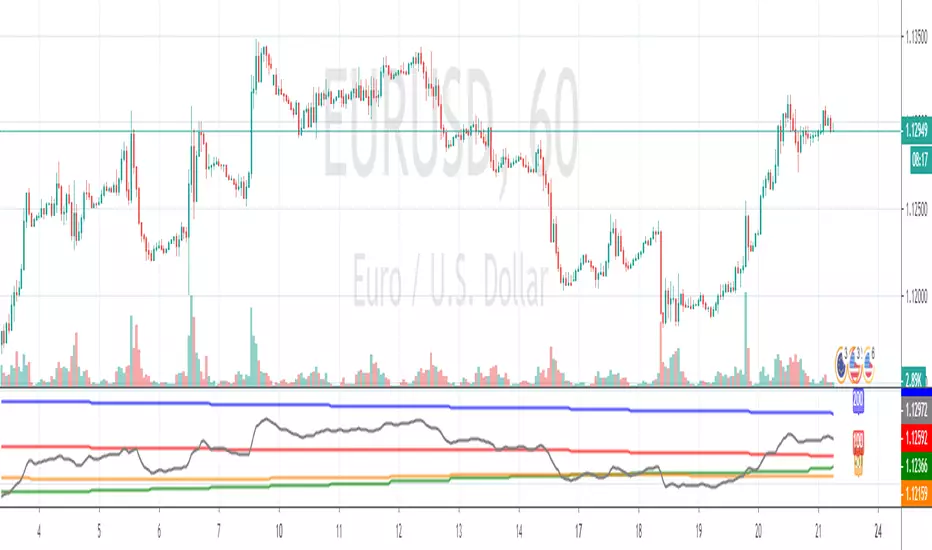
This is the best way I've found so far for gauging directional bias (i.e. overall trend) at-a-glance. It shows current price in black along with the 20, 50 & 100 daily MAs, all of which are visible at all times, and from all timeframes. No wondering where the 100MA is cause it's now showing on the chart. I also find this good for keeping my charts visually cleaner. Having the undulating lines moved underneath makes it easier for me to see support/resistance and other imporant stuff,
The trend is your friend and this helps to make sure you're on the right side of a trade.
The trend is your friend and this helps to make sure you're on the right side of a trade.
Phát hành các Ghi chú
Fixed screenshotPhát hành các Ghi chú
Added 200MA in blue, and 50 period Kijun (which is like a dynamic 50% fib) in brown, added some new options for hiding and offsetting the labelsMã nguồn mở
Theo đúng tinh thần TradingView, tác giả của tập lệnh này đã công bố nó dưới dạng mã nguồn mở, để các nhà giao dịch có thể xem xét và xác minh chức năng. Chúc mừng tác giả! Mặc dù bạn có thể sử dụng miễn phí, hãy nhớ rằng việc công bố lại mã phải tuân theo Nội quy.
Thông báo miễn trừ trách nhiệm
Thông tin và các ấn phẩm này không nhằm mục đích, và không cấu thành, lời khuyên hoặc khuyến nghị về tài chính, đầu tư, giao dịch hay các loại khác do TradingView cung cấp hoặc xác nhận. Đọc thêm tại Điều khoản Sử dụng.
Mã nguồn mở
Theo đúng tinh thần TradingView, tác giả của tập lệnh này đã công bố nó dưới dạng mã nguồn mở, để các nhà giao dịch có thể xem xét và xác minh chức năng. Chúc mừng tác giả! Mặc dù bạn có thể sử dụng miễn phí, hãy nhớ rằng việc công bố lại mã phải tuân theo Nội quy.
Thông báo miễn trừ trách nhiệm
Thông tin và các ấn phẩm này không nhằm mục đích, và không cấu thành, lời khuyên hoặc khuyến nghị về tài chính, đầu tư, giao dịch hay các loại khác do TradingView cung cấp hoặc xác nhận. Đọc thêm tại Điều khoản Sử dụng.