OPEN-SOURCE SCRIPT
Cập nhật SATHYA SMA Signal)
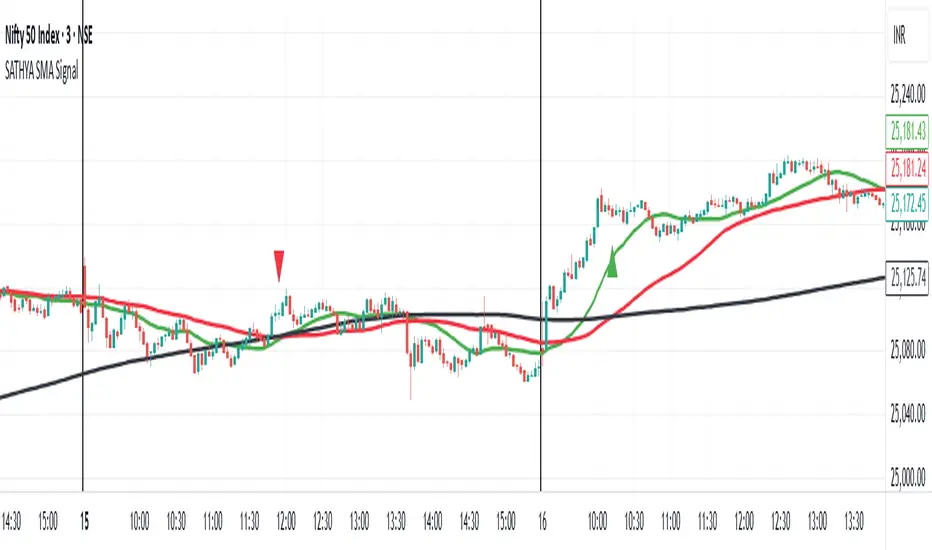
This indicator overlays 20, 50, and 200 Simple Moving Averages (SMAs) on the chart. It generates bullish signals when the 20 SMA crosses above the 200 SMA before the 50 SMA, with both above 200 SMA. Bearish signals occur when the 20 SMA crosses below the 200 SMA before the 50 SMA, with both below 200 SMA. Signals appear as distinct triangles on the chart, helping traders identify trend reversals based on systematic SMA crossovers and order of crossing.
Phát hành các Ghi chú
This indicator overlays 20, 50, and 200 Simple Moving Averages (SMAs) on the chart. It generates bullish signals when the 20 SMA crosses above the 200 SMA before the 50 SMA, with both above 200 SMA. Bearish signals occur when the 20 SMA crosses below the 200 SMA before the 50 SMA, with both below 200 SMA. Signals appear as distinct triangles on the chart, helping traders identify trend reversals based on systematic SMA crossovers and order of crossing.Mã nguồn mở
Theo đúng tinh thần TradingView, tác giả của tập lệnh này đã công bố nó dưới dạng mã nguồn mở, để các nhà giao dịch có thể xem xét và xác minh chức năng. Chúc mừng tác giả! Mặc dù bạn có thể sử dụng miễn phí, hãy nhớ rằng việc công bố lại mã phải tuân theo Nội quy.
Thông báo miễn trừ trách nhiệm
Thông tin và các ấn phẩm này không nhằm mục đích, và không cấu thành, lời khuyên hoặc khuyến nghị về tài chính, đầu tư, giao dịch hay các loại khác do TradingView cung cấp hoặc xác nhận. Đọc thêm tại Điều khoản Sử dụng.
Mã nguồn mở
Theo đúng tinh thần TradingView, tác giả của tập lệnh này đã công bố nó dưới dạng mã nguồn mở, để các nhà giao dịch có thể xem xét và xác minh chức năng. Chúc mừng tác giả! Mặc dù bạn có thể sử dụng miễn phí, hãy nhớ rằng việc công bố lại mã phải tuân theo Nội quy.
Thông báo miễn trừ trách nhiệm
Thông tin và các ấn phẩm này không nhằm mục đích, và không cấu thành, lời khuyên hoặc khuyến nghị về tài chính, đầu tư, giao dịch hay các loại khác do TradingView cung cấp hoặc xác nhận. Đọc thêm tại Điều khoản Sử dụng.