OPEN-SOURCE SCRIPT
Choose Symbol, candle and line mode
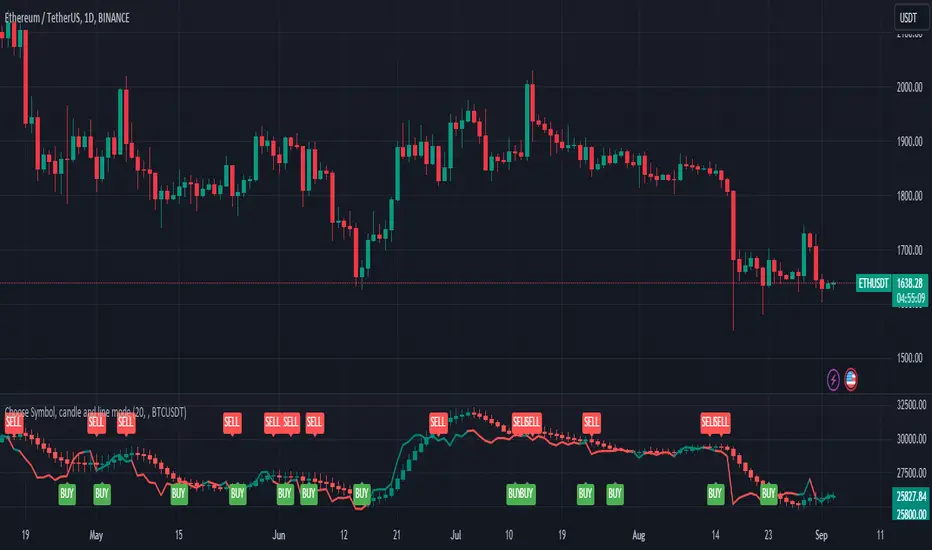
This indicator plots candlesticks or line charts based on user-specified symbol and price data in the time frame. The user can also choose whether this indicator works in normal mode or Heikin-Ashi mode. Here are the features of this indicator:
1. **Trend and Normal Modes:** User can choose to operate the indicator in two different modes. In "Trend Mode" the indicator plots the moving average of the price based on the specified period length. In the "Normal Mode", it draws the opening, high, low and closing prices similar to the Heikin-Ashi candlesticks.
2. **Time Zone Selection:** User can select a different time zone to operate this indicator. By default, the current chart timeframe is used.
3. **Symbol Selection:** The indicator uses the price data from the specified symbol. The user can specify the symbol in the format "SYMBOL:PAIR".
4. **Buy-Sell Signals:** The indicator identifies buy and sell signals based on a certain period length. A buy signal occurs when the price goes above the line, while a sell signal occurs when the price goes below the line.
5. **Buy-Sell Alerts:** Alerts are sent to the user for buying and selling signals.
6. **Display on Chart:** The indicator draws candlesticks or line chart with specified modes and colors. It also marks the buying and selling points on the chart.
This indicator is used to analyze price movements in the specified symbol and time frame and to assist in buying and selling decisions. It has a user-friendly and customizable interface.
It is for idea purposes only, does not contain investment advice.
Mã nguồn mở
Theo đúng tinh thần TradingView, tác giả của tập lệnh này đã công bố nó dưới dạng mã nguồn mở, để các nhà giao dịch có thể xem xét và xác minh chức năng. Chúc mừng tác giả! Mặc dù bạn có thể sử dụng miễn phí, hãy nhớ rằng việc công bố lại mã phải tuân theo Nội quy.
Thông báo miễn trừ trách nhiệm
Thông tin và các ấn phẩm này không nhằm mục đích, và không cấu thành, lời khuyên hoặc khuyến nghị về tài chính, đầu tư, giao dịch hay các loại khác do TradingView cung cấp hoặc xác nhận. Đọc thêm tại Điều khoản Sử dụng.