OPEN-SOURCE SCRIPT
Crypto Correlation Oscillator
# Crypto Correlation Oscillator
**Companion indicator for Tri-Align Crypto Trend**
## Overview
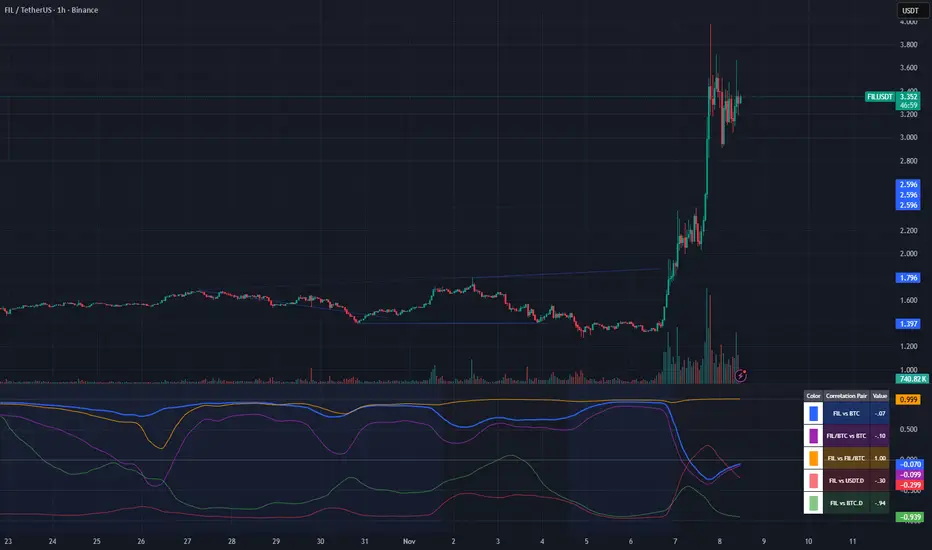
The Crypto Correlation Oscillator helps you identify **alpha opportunities** and **market regime changes** by showing how closely your coin follows Bitcoin and other assets over time. It displays rolling correlations as an oscillator in a separate pane below your price chart.
## What It Does
This indicator calculates **Pearson correlations** between different trading pairs on a rolling window (default: 100 bars). Correlations range from **-1.0** (perfect inverse relationship) to **+1.0** (perfect positive relationship), with **0** meaning no correlation.
### The 5 Correlation Lines
1. **Blue (thick line) - Coin vs BTC**: The most important metric
- **High correlation (>0.7)**: Your coin is just following BTC - no independent movement
- **Low correlation (<0.3)**: Your coin has **alpha** - it's moving independently from BTC
- **Negative correlation**: Your coin moves opposite to BTC (rare but powerful)
2. **Purple - Coin/BTC vs BTC**: Inverse relationship check
- **Negative values**: When BTC rises, your coin weakens relative to BTC
- **Positive values**: When BTC rises, your coin strengthens against BTC
3. **Orange - Coin vs Coin/BTC**: Structural consistency check
- Shows how well the Coin/USDT and Coin/BTC pairs maintain their mathematical relationship
- Unusual values can indicate liquidity issues or market inefficiencies
4. **Light Red - Coin vs USDT.D** (optional): Stablecoin dominance correlation
- Shows how your coin correlates with USDT dominance
- Useful for understanding flight-to-safety dynamics
5. **Light Green - Coin vs BTC.D** (optional): Bitcoin dominance correlation
- Shows how your coin correlates with BTC dominance
- Helps identify altcoin season vs BTC dominance cycles
## How to Read It
### Finding Alpha Opportunities
- **Low blue line (<0.3)**: Your coin is decoupled from BTC → potential alpha
- **Blue line dropping**: Coin is gaining independence from BTC
- **Blue line spiking to >0.9**: Coin is a "BTC clone" with no independent movement
### Regime Change Detection
- **Blue line crossing 0.5**: Major shift in correlation behavior
- **Purple line turning negative**: Coin starting to weaken when BTC rises (warning sign)
- **Sharp correlation changes**: Market structure is shifting - adjust strategy
### Visual Zones
- **Blue background**: High correlation zone (>0.7) - coin just following BTC
- **Red background**: Inverse correlation zone (<-0.5) - coin moving opposite to BTC
### Reference Lines
- **+1.0 / -1.0**: Perfect correlation boundaries (dotted gray)
- **+0.5 / -0.5**: Moderate correlation thresholds (dotted gray)
- **0.0**: Zero correlation line (solid gray)
## Dynamic Legend
The legend table (top-right) automatically shows the actual symbol names based on your chart:
- **Example on SOLUSDT**: Shows "SOL vs BTC", "SOL/BTC vs BTC", "SOL vs SOL/BTC", etc.
- **Color boxes**: Match the plot colors for easy identification
- **Live values**: Current correlation numbers update in real-time
- **Tooltips**: Hover over labels for interpretation guidance
## Configuration
### Key Inputs
- **Correlation Lookback** (default: 100): Number of bars for rolling correlation window
- Shorter = more reactive, noisier
- Longer = smoother, slower to detect changes
- **Correlation Smoothing** (default: 5): EMA smoothing period for raw correlations
- Reduces noise while preserving trends
- **Symbol Detection**: Auto-detects symbols from your chart, or use manual overrides
- **Dominance Pairs**: Toggle USDT.D and BTC.D correlations on/off
## Usage Tips
1. **Combine with main Tri-Align indicator**: Use correlation for context, Tri-Align for entry/exit signals
2. **Watch for divergences**: Correlation changing while price moves in sync can signal upcoming shift
3. **Adjust lookback period**: Use shorter (50-70) for day trading, longer (150-200) for position trading
4. **Focus on the blue line**: It's your primary alpha indicator
## Technical Details
- **Calculation**: Pearson correlation coefficient with EMA smoothing
- **Data source**: Close prices from `request.security()` (multi-timeframe capable)
- **Update frequency**: Every bar on your selected timeframe
- **Overlay**: False (displays in separate pane)
## Quick Interpretation Guide
| Blue Line Value | Interpretation | Action |
|----------------|----------------|--------|
| > 0.9 | Coin is a BTC clone | Avoid - no alpha opportunity |
| 0.7 - 0.9 | High correlation | Standard altcoin behavior |
| 0.3 - 0.7 | Moderate correlation | Some independence emerging |
| < 0.3 | Low correlation | **Strong alpha opportunity** |
| < 0 | Inverse correlation | Rare - potential hedge asset |
| Purple Line | Interpretation |
|-------------|----------------|
| Strongly negative | Coin weakens when BTC rises - risky |
| Near zero | Coin/BTC pair moves independently of BTC |
| Positive | Coin strengthens with BTC - ideal |
## Version History
### v1.0 (Initial Release)
- Pearson correlation calculation with configurable lookback
- 5 correlation pairs: Coin vs BTC, Coin/BTC vs BTC, Coin vs Coin/BTC, USDT.D, BTC.D
- EMA smoothing to reduce noise
- Visual zones for high/inverse correlation
- Dynamic legend with symbol name extraction
- Auto-symbol detection matching main Tri-Align indicator
**Companion indicator for Tri-Align Crypto Trend**
## Overview
The Crypto Correlation Oscillator helps you identify **alpha opportunities** and **market regime changes** by showing how closely your coin follows Bitcoin and other assets over time. It displays rolling correlations as an oscillator in a separate pane below your price chart.
## What It Does
This indicator calculates **Pearson correlations** between different trading pairs on a rolling window (default: 100 bars). Correlations range from **-1.0** (perfect inverse relationship) to **+1.0** (perfect positive relationship), with **0** meaning no correlation.
### The 5 Correlation Lines
1. **Blue (thick line) - Coin vs BTC**: The most important metric
- **High correlation (>0.7)**: Your coin is just following BTC - no independent movement
- **Low correlation (<0.3)**: Your coin has **alpha** - it's moving independently from BTC
- **Negative correlation**: Your coin moves opposite to BTC (rare but powerful)
2. **Purple - Coin/BTC vs BTC**: Inverse relationship check
- **Negative values**: When BTC rises, your coin weakens relative to BTC
- **Positive values**: When BTC rises, your coin strengthens against BTC
3. **Orange - Coin vs Coin/BTC**: Structural consistency check
- Shows how well the Coin/USDT and Coin/BTC pairs maintain their mathematical relationship
- Unusual values can indicate liquidity issues or market inefficiencies
4. **Light Red - Coin vs USDT.D** (optional): Stablecoin dominance correlation
- Shows how your coin correlates with USDT dominance
- Useful for understanding flight-to-safety dynamics
5. **Light Green - Coin vs BTC.D** (optional): Bitcoin dominance correlation
- Shows how your coin correlates with BTC dominance
- Helps identify altcoin season vs BTC dominance cycles
## How to Read It
### Finding Alpha Opportunities
- **Low blue line (<0.3)**: Your coin is decoupled from BTC → potential alpha
- **Blue line dropping**: Coin is gaining independence from BTC
- **Blue line spiking to >0.9**: Coin is a "BTC clone" with no independent movement
### Regime Change Detection
- **Blue line crossing 0.5**: Major shift in correlation behavior
- **Purple line turning negative**: Coin starting to weaken when BTC rises (warning sign)
- **Sharp correlation changes**: Market structure is shifting - adjust strategy
### Visual Zones
- **Blue background**: High correlation zone (>0.7) - coin just following BTC
- **Red background**: Inverse correlation zone (<-0.5) - coin moving opposite to BTC
### Reference Lines
- **+1.0 / -1.0**: Perfect correlation boundaries (dotted gray)
- **+0.5 / -0.5**: Moderate correlation thresholds (dotted gray)
- **0.0**: Zero correlation line (solid gray)
## Dynamic Legend
The legend table (top-right) automatically shows the actual symbol names based on your chart:
- **Example on SOLUSDT**: Shows "SOL vs BTC", "SOL/BTC vs BTC", "SOL vs SOL/BTC", etc.
- **Color boxes**: Match the plot colors for easy identification
- **Live values**: Current correlation numbers update in real-time
- **Tooltips**: Hover over labels for interpretation guidance
## Configuration
### Key Inputs
- **Correlation Lookback** (default: 100): Number of bars for rolling correlation window
- Shorter = more reactive, noisier
- Longer = smoother, slower to detect changes
- **Correlation Smoothing** (default: 5): EMA smoothing period for raw correlations
- Reduces noise while preserving trends
- **Symbol Detection**: Auto-detects symbols from your chart, or use manual overrides
- **Dominance Pairs**: Toggle USDT.D and BTC.D correlations on/off
## Usage Tips
1. **Combine with main Tri-Align indicator**: Use correlation for context, Tri-Align for entry/exit signals
2. **Watch for divergences**: Correlation changing while price moves in sync can signal upcoming shift
3. **Adjust lookback period**: Use shorter (50-70) for day trading, longer (150-200) for position trading
4. **Focus on the blue line**: It's your primary alpha indicator
## Technical Details
- **Calculation**: Pearson correlation coefficient with EMA smoothing
- **Data source**: Close prices from `request.security()` (multi-timeframe capable)
- **Update frequency**: Every bar on your selected timeframe
- **Overlay**: False (displays in separate pane)
## Quick Interpretation Guide
| Blue Line Value | Interpretation | Action |
|----------------|----------------|--------|
| > 0.9 | Coin is a BTC clone | Avoid - no alpha opportunity |
| 0.7 - 0.9 | High correlation | Standard altcoin behavior |
| 0.3 - 0.7 | Moderate correlation | Some independence emerging |
| < 0.3 | Low correlation | **Strong alpha opportunity** |
| < 0 | Inverse correlation | Rare - potential hedge asset |
| Purple Line | Interpretation |
|-------------|----------------|
| Strongly negative | Coin weakens when BTC rises - risky |
| Near zero | Coin/BTC pair moves independently of BTC |
| Positive | Coin strengthens with BTC - ideal |
## Version History
### v1.0 (Initial Release)
- Pearson correlation calculation with configurable lookback
- 5 correlation pairs: Coin vs BTC, Coin/BTC vs BTC, Coin vs Coin/BTC, USDT.D, BTC.D
- EMA smoothing to reduce noise
- Visual zones for high/inverse correlation
- Dynamic legend with symbol name extraction
- Auto-symbol detection matching main Tri-Align indicator
Mã nguồn mở
Theo đúng tinh thần TradingView, tác giả của tập lệnh này đã công bố nó dưới dạng mã nguồn mở, để các nhà giao dịch có thể xem xét và xác minh chức năng. Chúc mừng tác giả! Mặc dù bạn có thể sử dụng miễn phí, hãy nhớ rằng việc công bố lại mã phải tuân theo Nội quy.
Thông báo miễn trừ trách nhiệm
Thông tin và các ấn phẩm này không nhằm mục đích, và không cấu thành, lời khuyên hoặc khuyến nghị về tài chính, đầu tư, giao dịch hay các loại khác do TradingView cung cấp hoặc xác nhận. Đọc thêm tại Điều khoản Sử dụng.