OPEN-SOURCE SCRIPT
Cập nhật Elgrand - Overbought/sold Rsi + Stochastic zones
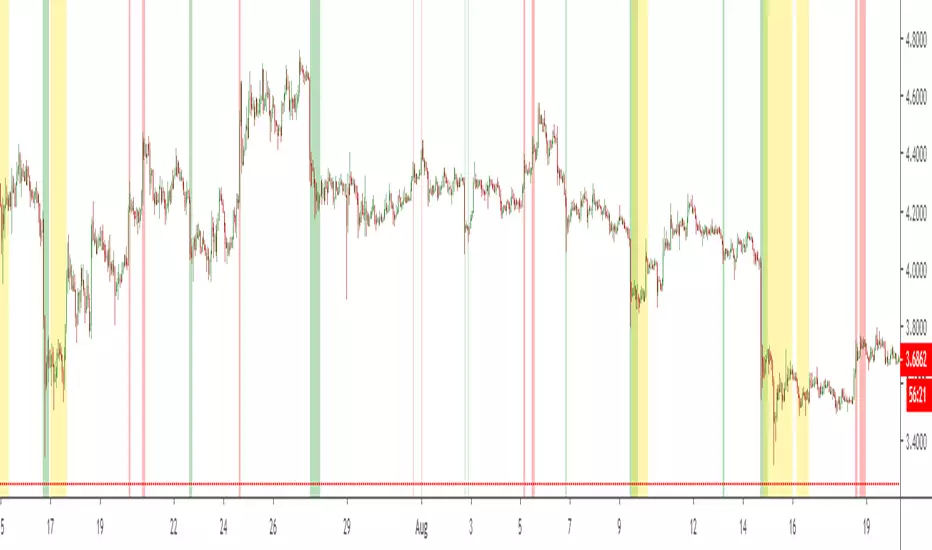
Visualize on your chart when price in an oversold or overbought zone. A combination of Rsi and Stochasticrsi is used for higher probability. Wait for an zone to be displayed and then wait for price to exit a zone. Once this happens check candlestick patterns and support/resistance "lines" to find appropiate stoplosses for you entry or exit
Phát hành các Ghi chú
Update :- Upgraded to use version 4 of Pinescript
Added and extra timeframe which will show in yellow on your chart : this way you can decide to enter exit if 1H overbought/oversold is also happening on the 4H timeframe. Idea is that this will lower your entry/exit risk.
Todo :
- Make the parent timeframe display optional
Be able to choose per timeframe which parent timeframe you would like to use
Mã nguồn mở
Theo đúng tinh thần TradingView, tác giả của tập lệnh này đã công bố nó dưới dạng mã nguồn mở, để các nhà giao dịch có thể xem xét và xác minh chức năng. Chúc mừng tác giả! Mặc dù bạn có thể sử dụng miễn phí, hãy nhớ rằng việc công bố lại mã phải tuân theo Nội quy.
Thông báo miễn trừ trách nhiệm
Thông tin và các ấn phẩm này không nhằm mục đích, và không cấu thành, lời khuyên hoặc khuyến nghị về tài chính, đầu tư, giao dịch hay các loại khác do TradingView cung cấp hoặc xác nhận. Đọc thêm tại Điều khoản Sử dụng.