OPEN-SOURCE SCRIPT
Supply Demand by WowTradingInfo
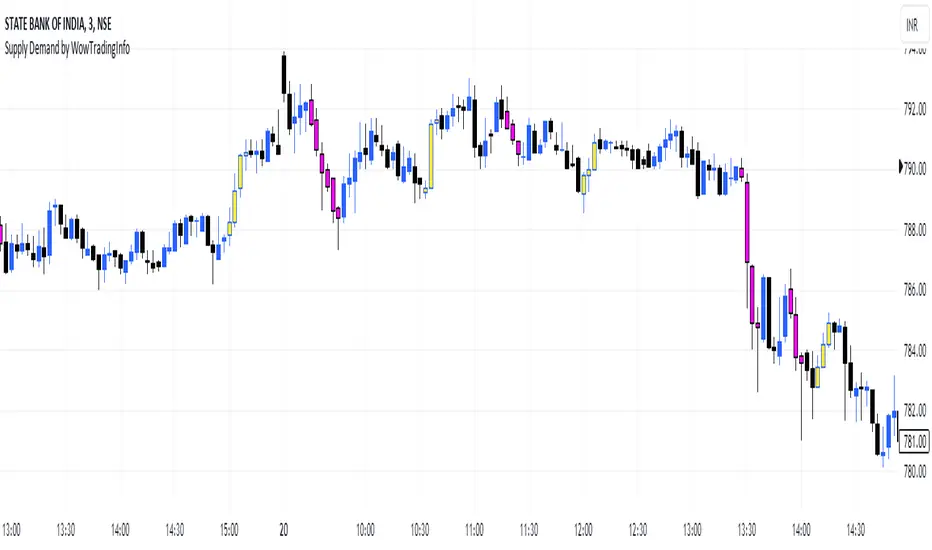
This indicator identifies supply and demand zones based on price action, which is a crucial concept for technical analysis. Supply zones represent areas where the price has historically shown selling pressure, while demand zones show areas with strong buying interest.
Explanation:
Rally-Base-Rally (RBR):
A rally is defined as a price movement where the percentage increase between the current high and the previous low.
A base is defined as a period of consolidation where price stays within a narrow range, with low volatility.
A RBR pattern is detected when a rally occurs, followed by a base, and then another rally.
Drop-Base-Drop (DBD):
A drop is identified when the price decrease between the current low and the previous high.
A DBD pattern is detected when a drop occurs, followed by a base, and then another drop.
Zone Marking:
RBR Zones are drawn with repaint the candles color as yellow (where buyers are likely to step in).
DBD Zones are drawn with repaint the candles color as pink (where sellers are likely to step in).
Example Use Case:
Rally-Base-Rally: When you see a yellow zone, it suggests that price rallied, consolidated, and is likely to rally again. It can be used as a potential demand zone.
Drop-Base-Drop: pink zones indicate that price dropped, consolidated, and may drop again. It can be used as a potential supply zone.
This script will help you automatically detect and visualize RBR and DBD patterns on your TradingView chart. These zones can provide valuable insights into areas where price may react due to past buying or selling pressure.
Mã nguồn mở
Theo đúng tinh thần TradingView, tác giả của tập lệnh này đã công bố nó dưới dạng mã nguồn mở, để các nhà giao dịch có thể xem xét và xác minh chức năng. Chúc mừng tác giả! Mặc dù bạn có thể sử dụng miễn phí, hãy nhớ rằng việc công bố lại mã phải tuân theo Nội quy.
Thông báo miễn trừ trách nhiệm
Thông tin và các ấn phẩm này không nhằm mục đích, và không cấu thành, lời khuyên hoặc khuyến nghị về tài chính, đầu tư, giao dịch hay các loại khác do TradingView cung cấp hoặc xác nhận. Đọc thêm tại Điều khoản Sử dụng.