OPEN-SOURCE SCRIPT
HTF Trend Tracker [BigBeluga]
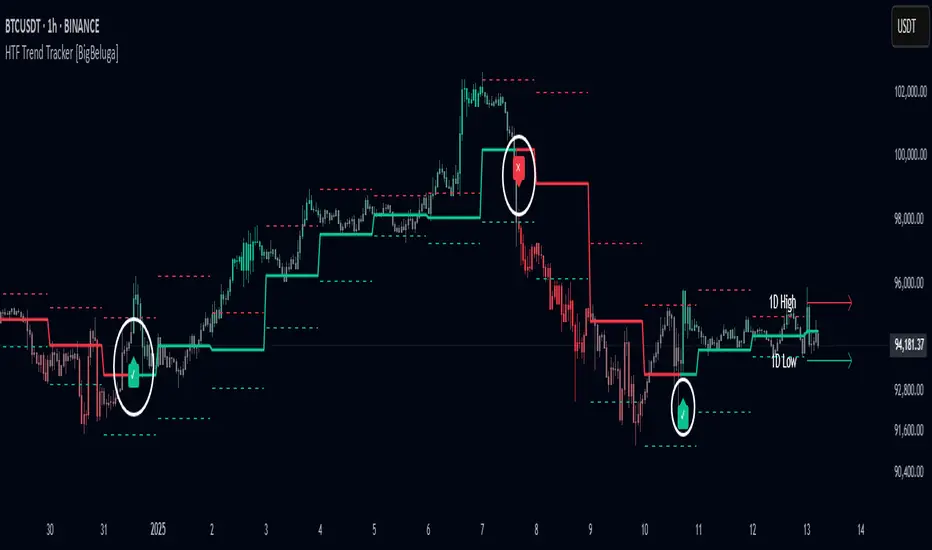
HTF Trend Tracker [BigBeluga] is a higher timeframe (HTF) trend tracking indicator designed to help traders identify significant trends, key levels, and market sentiment. The indicator dynamically adapts to the current price action, using HTF highs and lows to display trend direction and strength with detailed visuals.

🔵Key Features:
Dynamic Trend Detection:
Historical and Active HTF Levels:
🔵Key Features:
Dynamic Trend Detection:
- Uptrend is identified when the price closes above the HTF high.
- Downtrend is detected when the price closes below the HTF low.
- Midline changes color dynamically based on the trend direction:
- Bullish Green: Indicates an uptrend.
- Bearish Red: Indicates a downtrend.
Historical and Active HTF Levels:
- Historic HTF highs and lows are displayed as dotted lines.
- Current active HTF high and low levels are shown as solid lines.
- Timeframe labels (e.g., "1D High" or "1D Low") mark the active levels for clarity.
Trend Change Signals:
- A green checkmark (✓) is plotted when an uptrend starts.
- A red cross (✕) appears when a downtrend begins.
- Candle colors change dynamically based on the trend and the price's distance from the midline:
- Intense Bullish Green: Price is far above the midline during an uptrend.
- Intense Bearish Red: Price is far below the midline during a downtrend.
- Neutral Gray: Price is near the midline.
- Users can customize the colors to suit their preferences.
🔵Usage:- Identify uptrends and downtrends using the midline's color and the position of the close relative to the HTF levels.
- Use solid lines and timeframe labels to track current HTF high and low levels.
- Observe dotted lines for historical HTF levels to understand past price behavior.
- Watch for checkmark (✓) and cross (✕) signals to spot trend changes and key market shifts.
- Monitor candle colors to gauge trend intensity and proximity to the midline:
- Intense colors signal strong trends, while neutral gray indicates consolidation near the midline.
- A green checkmark (✓) is plotted when an uptrend starts.
Mã nguồn mở
Theo đúng tinh thần TradingView, tác giả của tập lệnh này đã công bố nó dưới dạng mã nguồn mở, để các nhà giao dịch có thể xem xét và xác minh chức năng. Chúc mừng tác giả! Mặc dù bạn có thể sử dụng miễn phí, hãy nhớ rằng việc công bố lại mã phải tuân theo Nội quy.
🔵Gain access to our powerful tools : bigbeluga.com/tv
🔵Join our free discord for updates : bigbeluga.com/discord
All scripts & content provided by BigBeluga are for informational & educational purposes only.
🔵Join our free discord for updates : bigbeluga.com/discord
All scripts & content provided by BigBeluga are for informational & educational purposes only.
Thông báo miễn trừ trách nhiệm
Thông tin và các ấn phẩm này không nhằm mục đích, và không cấu thành, lời khuyên hoặc khuyến nghị về tài chính, đầu tư, giao dịch hay các loại khác do TradingView cung cấp hoặc xác nhận. Đọc thêm tại Điều khoản Sử dụng.