OPEN-SOURCE SCRIPT
Cập nhật LowHighFinder
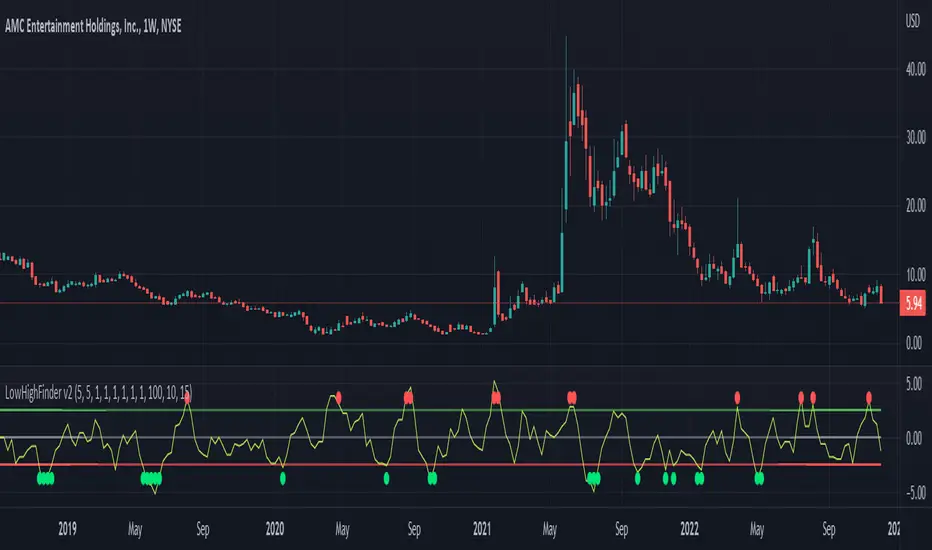
This chart display how value change of (low,high,close,open) is considered as a factor for buying or selling. Each element take same weight when consider the final price. The price change over a certain threshold would be the decision point (buy/sell)
Factors considered in this chart
1.Quotes: High,low,close,open,volume. If one of them higher than previous day, then it increase, otherwise decreases.
2. Multipler: If you think one quote is more important than other (High more important than close, you can set multipler higher)
3. EMA smoother: It is using to balance the price effect. Like if price increased dramatically, EMA would notify whether could be a good time to sell. (Because high deviation between MA and price suggest price increase too fast)
4. Length of line: set length of line for you need
5. Percentage change: how much percentage change is considered a significant change? 5%? or 10%? In which case should it count toward the final indicator? Adjust percentage change needed, smaller for minutes chart (less than 10) higher for hours chart (10-20), even higher for day chart
Buy/Sell method:
1. When green dot appears, wait after price start to get close to moving average to find the low point and buy.
2. Reverse for red dot.
Phát hành các Ghi chú
Update: 2022/12/121. Red dot not showing
Mã nguồn mở
Theo đúng tinh thần TradingView, tác giả của tập lệnh này đã công bố nó dưới dạng mã nguồn mở, để các nhà giao dịch có thể xem xét và xác minh chức năng. Chúc mừng tác giả! Mặc dù bạn có thể sử dụng miễn phí, hãy nhớ rằng việc công bố lại mã phải tuân theo Nội quy.
Thông báo miễn trừ trách nhiệm
Thông tin và các ấn phẩm này không nhằm mục đích, và không cấu thành, lời khuyên hoặc khuyến nghị về tài chính, đầu tư, giao dịch hay các loại khác do TradingView cung cấp hoặc xác nhận. Đọc thêm tại Điều khoản Sử dụng.