OPEN-SOURCE SCRIPT
Cập nhật Buyer vs Seller Control
BUYER vs SELLER CONTROL INDICATOR
Identify market dominance and potential trend shifts with wick analysis
What This Indicator Measures:
This indicator analyzes who controls the market by measuring the battle between buyers and sellers on each candle:
What's Plotted:
How to Read the Signals:
Trading Applications:
Key Features:
Pro Tip: Use this with your favorite trend or momentum indicators for confluence. Strong buyer/seller control often precedes significant price moves!
Pine Script®
Identify market dominance and potential trend shifts with wick analysis
What This Indicator Measures:
This indicator analyzes who controls the market by measuring the battle between buyers and sellers on each candle:
- Buyer Control: How far the closing price is above the candle's low (bottom wick strength)
- Seller Control: How far the closing price is below the candle's high (top wick strength)
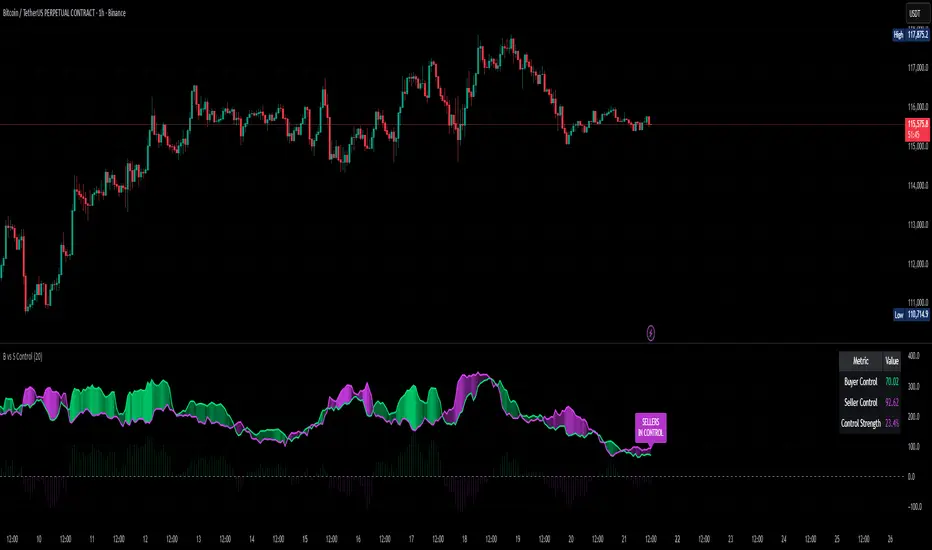
What's Plotted:
- Lime Line: 20-period moving average of buyer control
- Fuchsia Line: 20-period moving average of seller control
- Dynamic Fill: Area between lines - color shows who's winning
- Histogram: Shows the difference between buyer and seller control
- Control Label: Text showing current market dominance
- Info Table: Real-time values and control strength percentage
How to Read the Signals:
🟢 LIME FILL = BUYERS IN CONTROL
When the lime line is above fuchsia, buyers are dominating. The brighter the fill, the stronger their control.
🔴 FUCHSIA FILL = SELLERS IN CONTROL
When the fuchsia line is above lime, sellers are dominating. The brighter the fill, the stronger their control.
Trading Applications:
- Trend Confirmation: Strong buyer control confirms uptrends, strong seller control confirms downtrends
- Reversal Signals: Watch for control shifts - when lines cross, momentum may be changing
- Entry Timing: Enter long when buyer control strengthens, short when seller control strengthens
- Market Structure: Persistent control by one side suggests strong directional bias
Key Features:
- Works on any timeframe
- Customizable moving average period (default: 20)
- Optional info table display
- Dynamic transparency shows control strength
- Clean visual design for both dark and light themes
Pro Tip: Use this with your favorite trend or momentum indicators for confluence. Strong buyer/seller control often precedes significant price moves!
// Based on wick analysis and moving averages
// Green = Buyers dominating market
// Red = Sellers dominating market
// Fill intensity = Control strength
Phát hành các Ghi chú
- Fix label cumulation bug
Phát hành các Ghi chú
- Support Volume Based Chart Display
Mã nguồn mở
Theo đúng tinh thần TradingView, người tạo ra tập lệnh này đã biến tập lệnh thành mã nguồn mở để các nhà giao dịch có thể xem xét và xác minh công năng. Xin dành lời khen tặng cho tác giả! Mặc dù bạn có thể sử dụng miễn phí, nhưng lưu ý nếu đăng lại mã, bạn phải tuân theo Quy tắc nội bộ của chúng tôi.
Get access to our indicators at: huntergatherers.tech
Thông báo miễn trừ trách nhiệm
Thông tin và ấn phẩm không có nghĩa là và không cấu thành, tài chính, đầu tư, kinh doanh, hoặc các loại lời khuyên hoặc khuyến nghị khác được cung cấp hoặc xác nhận bởi TradingView. Đọc thêm trong Điều khoản sử dụng.