CycleVISION [BitAura]
This Pine Script® indicator combines a long-term trend-following strategy with a cycle valuation Z-score analysis to generate a Trend Probability Indicator (TPI). The TPI aggregates signals from multiple trend and on-chain metrics to identify optimal entry and exit points for a single asset, with USD as a cash position. The system also calculates a comprehensive Z-score based on performance and valuation metrics to assess market cycles, aiming to enhance risk-adjusted returns for long-term investors.
Logic and Core Concepts
The 𝐂ycle𝑽𝑰𝑺𝑰𝑶𝑵 System uses two primary components to guide investing decisions:
1. Trend Probability Indicator (TPI)
- Mechanism: Aggregates five proprietary, universal, trend signals and three on-chain metrics into a composite TPI score, normalized between -1 and 1.
- Thresholds: Enters a long position when the TPI score exceeds a user-defined long threshold (default: 0.0) and exits to cash when it falls below a short threshold (default: -0.5).
- Execution: Trades are executed only on confirmed bars within a user-specified backtest date range, ensuring robust signal reliability.
2. Cycle Valuation Z-Score
- Mechanism: Computes an average Z-score from six metrics: Sharpe Ratio, Sortino Ratio, Omega Ratio, Weekly RSI, Crosby Ratio, and Price Z-Score, using a 1200-bar lookback period.
- Purpose: Identifies overvalued or undervalued market conditions to complement TPI signals, with thresholds at ±1.8 for extreme valuations.
[8]Visualization: Displays the average Z-score and individual components, with gradient-based bar coloring to reflect valuation strength.
Features
- Dynamic Trend Signals: Combines trend and on-chain data into a single TPI score for clear long/cash decisions.
- Comprehensive Valuation: Calculates Z-scores for multiple performance and price metrics to assess market cycles.
- Customizable Inputs: Allows users to adjust TPI thresholds, backtest date ranges, and valuation metrics visibility.
- Visual Outputs:
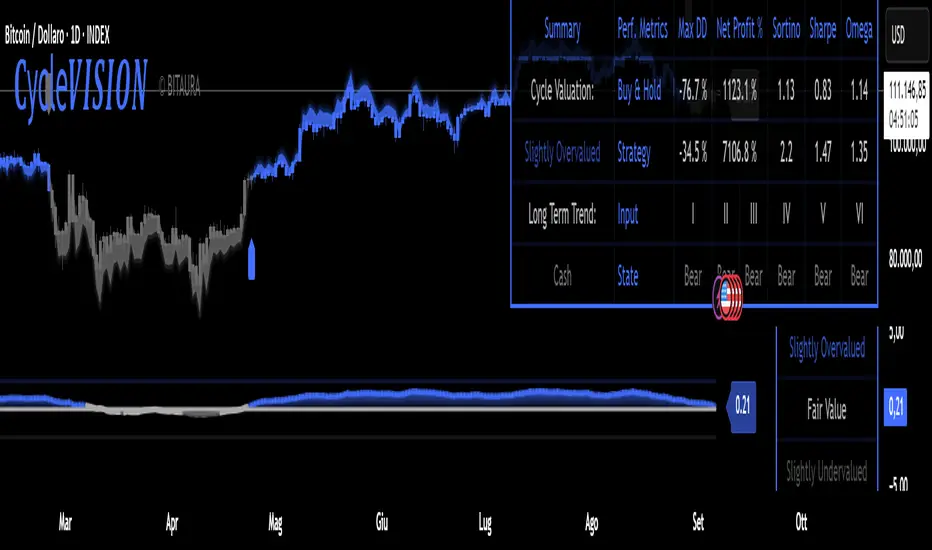
Valuation Table: Displays TPI score, Z-scores, and performance metrics (Sharpe, Sortino, Omega, Max Drawdown, Net Profit) in a configurable table (Lite, Medium, Full).
Equity Curve: Plots the system’s equity curve compared to buy-and-hold performance.
Price and TPI Plot: Overlays TPI-adjusted price bands with glow effects and filled gaps for trend visualization on the price chart.
Valuation Coloring: Applies backgrounds based on Z-score ranges (e.g., strong buy above 1.8, strong sell below -1.8). - Configurable Alerts: Notifies users of TPI signal changes (Long to Cash or Cash to Long) with detailed messages.
- Color Presets: Offers five color themes (e.g., Arctic Blast, Fire vs. Ice) or custom color options for long/short signals.
- Pine Script v6: Leverages matrices, tables, and gradient coloring for enhanced usability.
How to Use- Add to Chart: Apply the indicator to any chart (the chart’s ticker is used for calculations, e.g.,
 BTCUSD).
 - Configure Settings: Adjust TPI thresholds, backtest start date (default: 01 Feb 2018), and valuation metrics visibility in the Inputs menu.
- Select Color Theme: Choose a preset color mode (e.g., Arctic Blast) or enable custom colors in the Colors group.
- Monitor Outputs: Check the Valuation Table for TPI and Z-score data, and view the Price and TPI Plot for trend signals.
- Analyze Performance: Enable the equity curve and performance metrics in the Backtesting Options group to compare results.
- Set Alerts: Right-click a plot, select "Add alert," and choose "Trend Change: Long to Cash" or "Trend Change: Cash to Long" for notifications.
Notes- The script is closed-source.
- Use a standard price series (not Heikin Ashi or other non-standard types) for accurate results.
- The script avoids lookahead bias by using barmerge.lookahead_off in request.security() calls.
- A minimum 1200-bar lookback is mandatory for Z-score calculations to avoid errors, with warnings displayed if insufficient price history is available.
- The BitAura watermark can be toggled in the Table Settings group.
- Add to Chart: Apply the indicator to any chart (the chart’s ticker is used for calculations, e.g.,
Tập lệnh chỉ hiển thị cho người được mời
Chỉ những người dùng được tác giả chấp thuận mới có thể truy cập tập lệnh này. Bạn sẽ cần yêu cầu và được cấp quyền sử dụng. Thông thường quyền này được cấp sau khi thanh toán. Để biết thêm chi tiết, làm theo hướng dẫn của tác giả bên dưới hoặc liên hệ trực tiếp với BitAura.
TradingView KHÔNG khuyến nghị bạn trả phí hoặc sử dụng một tập lệnh trừ khi bạn hoàn toàn tin tưởng vào tác giả và hiểu cách hoạt động của tập lệnh. Bạn cũng có thể tìm các lựa chọn miễn phí, mã nguồn mở trong các script cộng đồng của chúng tôi.
Hướng dẫn của tác giả
Thông báo miễn trừ trách nhiệm
Tập lệnh chỉ hiển thị cho người được mời
Chỉ những người dùng được tác giả chấp thuận mới có thể truy cập tập lệnh này. Bạn sẽ cần yêu cầu và được cấp quyền sử dụng. Thông thường quyền này được cấp sau khi thanh toán. Để biết thêm chi tiết, làm theo hướng dẫn của tác giả bên dưới hoặc liên hệ trực tiếp với BitAura.
TradingView KHÔNG khuyến nghị bạn trả phí hoặc sử dụng một tập lệnh trừ khi bạn hoàn toàn tin tưởng vào tác giả và hiểu cách hoạt động của tập lệnh. Bạn cũng có thể tìm các lựa chọn miễn phí, mã nguồn mở trong các script cộng đồng của chúng tôi.