█ OVERVIEW
Library "e2hray"
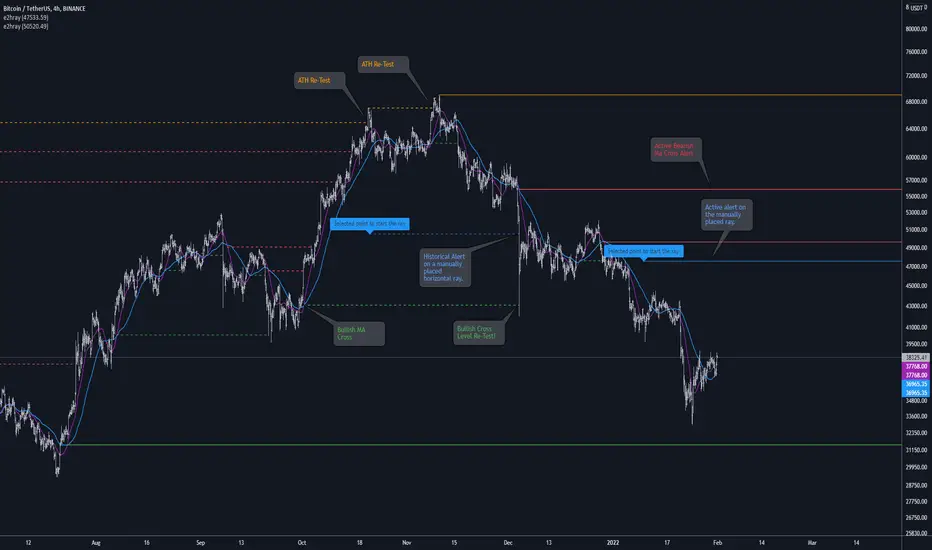
A drawing library that contains the hray() function, which draws a horizontal ray/s with an initial point determined by a specified condition. It plots a ray until it reached the price. The function let you control the visibility of historical levels and setup the alerts.
█ HORIZONTAL RAY FUNCTION
hray(condition, level, color, extend, hist_lines, alert_message, alert_delay, style, hist_style, width, hist_width)
Parameters:
condition: Boolean condition that defines the initial point of a ray
level: Ray price level.
color: Ray color.
extend: (optional) Default value true, current ray levels extend to the right, if false - up to the current bar.
hist_lines: (optional) Default value true, shows historical ray levels that were revisited, default is dashed lines. To avoid alert problems set to 'false' before creating alerts.
alert_message: (optional) Default value string(na), if declared, enables alerts that fire when price revisits a line, using the text specified
alert_delay: (optional) Default value int(0), number of bars to validate the level. Alerts won't trigger if the ray is broken during the 'delay'.
style: (optional) Default value 'line.style_solid'. Ray line style.
hist_style: (optional) Default value 'line.style_dashed'. Historical ray line style.
width: (optional) Default value int(1), ray width in pixels.
hist_width: (optional) Default value int(1), historical ray width in pixels.
Returns: void
█ EXAMPLES
• Example 1. Single horizontal ray from the dynamic input.
Pine Script®

• Example 2. Multiple horizontal rays on the moving averages cross.
Pine Script®

• Example 3. Horizontal ray at the all time highs with an alert.
Pine Script®

Library "e2hray"
A drawing library that contains the hray() function, which draws a horizontal ray/s with an initial point determined by a specified condition. It plots a ray until it reached the price. The function let you control the visibility of historical levels and setup the alerts.
█ HORIZONTAL RAY FUNCTION
hray(condition, level, color, extend, hist_lines, alert_message, alert_delay, style, hist_style, width, hist_width)
Parameters:
condition: Boolean condition that defines the initial point of a ray
level: Ray price level.
color: Ray color.
extend: (optional) Default value true, current ray levels extend to the right, if false - up to the current bar.
hist_lines: (optional) Default value true, shows historical ray levels that were revisited, default is dashed lines. To avoid alert problems set to 'false' before creating alerts.
alert_message: (optional) Default value string(na), if declared, enables alerts that fire when price revisits a line, using the text specified
alert_delay: (optional) Default value int(0), number of bars to validate the level. Alerts won't trigger if the ray is broken during the 'delay'.
style: (optional) Default value 'line.style_solid'. Ray line style.
hist_style: (optional) Default value 'line.style_dashed'. Historical ray line style.
width: (optional) Default value int(1), ray width in pixels.
hist_width: (optional) Default value int(1), historical ray width in pixels.
Returns: void
█ EXAMPLES
• Example 1. Single horizontal ray from the dynamic input.
//@version=5
indicator("hray() example :: Dynamic input ray", overlay = true)
import e2e4mfck/e2hray/1 as e2draw
inputTime = input.time(timestamp("20 Jul 2021 00:00 +0300"), "Date", confirm = true)
inputPrice = input.price(54, 'Price Level', confirm = true)
e2draw.hray(time == inputTime, inputPrice, color.blue, alert_message = 'Ray level re-test!')
var label mark = label.new(inputTime, inputPrice, 'Selected point to start the ray', xloc.bar_time)
• Example 2. Multiple horizontal rays on the moving averages cross.
//@version=5
indicator("hray() example :: MA Cross", overlay = true)
import e2e4mfck/e2hray/1 as e2draw
float sma1 = ta.sma(close, 20)
float sma2 = ta.sma(close, 50)
bullishCross = ta.crossover( sma1, sma2)
bearishCross = ta.crossunder(sma1, sma2)
plot(sma1, 'sma1', color.purple)
plot(sma2, 'sma2', color.blue)
// 1a. We can use 2 function calls to distinguish long and short sides.
e2draw.hray(bullishCross, sma1, color.green, alert_message = 'Bullish Cross Level Broken!', alert_delay = 10)
e2draw.hray(bearishCross, sma2, color.red, alert_message = 'Bearish Cross Level Broken!', alert_delay = 10)
// 1b. Or a single call for both.
// e2draw.hray(bullishCross or bearishCross, sma1, bullishCross ? color.green : color.red)
• Example 3. Horizontal ray at the all time highs with an alert.
//@version=5
indicator("hray() example :: ATH", overlay = true)
import e2e4mfck/e2hray/1 as e2draw
var float ath = 0, ath := math.max(high, ath)
bool newAth = ta.change(ath)
e2draw.hray(nz(newAth[1]), high[1], color.orange, alert_message = 'All Time Highs Tested!', alert_delay = 10)
Phát hành các Ghi chú
v2 - xloc context switched from 'bar_index' to 'time'.
- alert_delay should be declared in minutes instead of bars.
- deep history reference bug fixed.
Thư viện Pine
Theo đúng tinh thần TradingView, tác giả đã công bố mã Pine này như một thư viện mã nguồn mở để các lập trình viên Pine khác trong cộng đồng có thể tái sử dụng. Chúc mừng tác giả! Bạn có thể sử dụng thư viện này cho mục đích cá nhân hoặc trong các ấn phẩm mã nguồn mở khác, nhưng việc tái sử dụng mã này trong các ấn phẩm phải tuân theo Nội Quy.
Pisces swimming through the river
All their life against the stream
Searching for a hook to catch on
And see their sun beam
Then suffocate in painful tortures
On cutting tables of callous men
Under a knife of handsome butchers
Emeralds are ripped away
All their life against the stream
Searching for a hook to catch on
And see their sun beam
Then suffocate in painful tortures
On cutting tables of callous men
Under a knife of handsome butchers
Emeralds are ripped away
Thông báo miễn trừ trách nhiệm
Thông tin và các ấn phẩm này không nhằm mục đích, và không cấu thành, lời khuyên hoặc khuyến nghị về tài chính, đầu tư, giao dịch hay các loại khác do TradingView cung cấp hoặc xác nhận. Đọc thêm tại Điều khoản Sử dụng.