OPEN-SOURCE SCRIPT
Cập nhật Wyckoff Wave
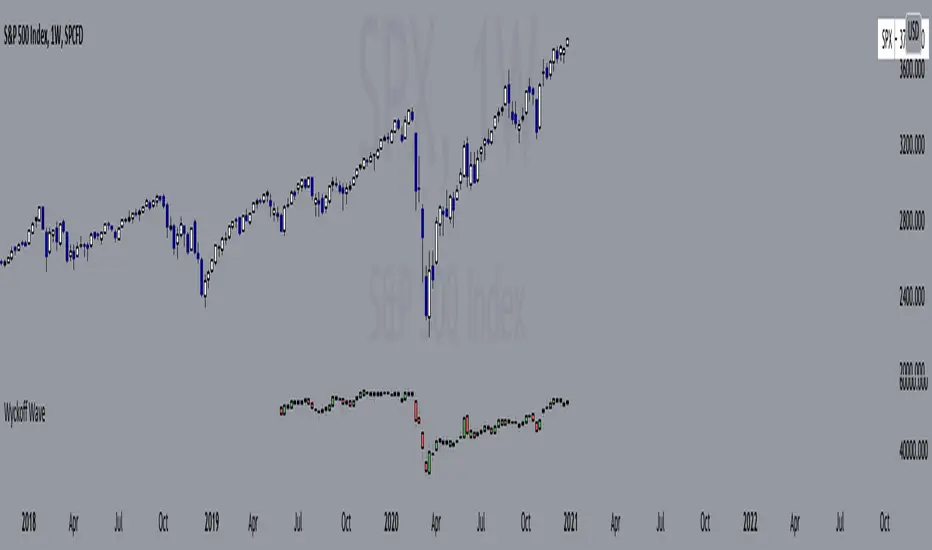
"The Wyckoff Wave is a weighted index consisting of 12 stocks that are leaders in their perspective industries. It was introduced by the Stock Market Institute in 1931.
Made up of leaders in the important stock groups, the Wyckoff Wave represents the core of the American industrial complex.
The Wyckoff Wave has been a market indicator for Wyckoff students for over 50 years. While the stocks comprising the Wyckoff Wave have changed over time, it continues to be a sensitive leading market indicator. The Wyckoff Wave has consistently identified market trends.
The Wyckoff Wave is extremely helpful in predicting the stock market’s timing and the direction of the next market move.
The Wyckoff Wave is analyzed in five minute intervals and individual up and down iintra-day waves are created.
These individual waves, which include the price action and volume during those brief up and down market swings, also provide the data for other important Wyckoff Stock Market Institute indicators, including the Optimism-Pessimism volume index and the Trend Barometer.
These 12 stocks that make up the Wyckoff Wave. They are listed, along with their multipliers, below."
Wave Stock / Multiplier
AT&T / 79
Bank of America / 50
Boeing / 39
Bristol Myers / 119
Caterpillar / 35
DowDuPont / 72
Exxon Mobile / 32
IBM / 21
General Electric / 90
Ford / 25
Union Pacific / 60
WalMart / 43
In 2019, DowDuPont split into three companies: Dow, DuPont, and Corteva. Because TV limits the number of securities in a script to 40, only Dow and DuPont are factored into the Wave calculation (higher market caps than Corteva) with a multiplier of 36 each.
Phát hành các Ghi chú
Condensed code to add Corteva, changed weightings for Dow, DuPont, and Corteva to 24 (DowDuPont/3). Now plots the true open value in real time.
Phát hành các Ghi chú
Added trendline to imagePhát hành các Ghi chú
Updated to include an option for repainting -- default value is true, meaning the script will repaint the current bar.False = Not Repainting = Value for the current bar is not repainted, but all past values are offset by 1 bar.
True = Repainting = Value for the current bar is repainted, but all past values are correct and not offset by 1 bar.
In both cases, all of the historical values are correct, it is just a matter of whether you prefer the current bar to be realistically painted and the historical bars offset by 1, or the current bar to be repainted and the historical data to match their respective price bars.
As explained by TradingView,`f_security()` is for coders who want to offer their users a repainting/no-repainting version of the HTF data.
Phát hành các Ghi chú
Removed the timeframe input to simplify the script.Mã nguồn mở
Theo đúng tinh thần TradingView, tác giả của tập lệnh này đã công bố nó dưới dạng mã nguồn mở, để các nhà giao dịch có thể xem xét và xác minh chức năng. Chúc mừng tác giả! Mặc dù bạn có thể sử dụng miễn phí, hãy nhớ rằng việc công bố lại mã phải tuân theo Nội quy.
Thông báo miễn trừ trách nhiệm
Thông tin và các ấn phẩm này không nhằm mục đích, và không cấu thành, lời khuyên hoặc khuyến nghị về tài chính, đầu tư, giao dịch hay các loại khác do TradingView cung cấp hoặc xác nhận. Đọc thêm tại Điều khoản Sử dụng.
Mã nguồn mở
Theo đúng tinh thần TradingView, tác giả của tập lệnh này đã công bố nó dưới dạng mã nguồn mở, để các nhà giao dịch có thể xem xét và xác minh chức năng. Chúc mừng tác giả! Mặc dù bạn có thể sử dụng miễn phí, hãy nhớ rằng việc công bố lại mã phải tuân theo Nội quy.
Thông báo miễn trừ trách nhiệm
Thông tin và các ấn phẩm này không nhằm mục đích, và không cấu thành, lời khuyên hoặc khuyến nghị về tài chính, đầu tư, giao dịch hay các loại khác do TradingView cung cấp hoặc xác nhận. Đọc thêm tại Điều khoản Sử dụng.