OPEN-SOURCE SCRIPT
Super Technical Ratings
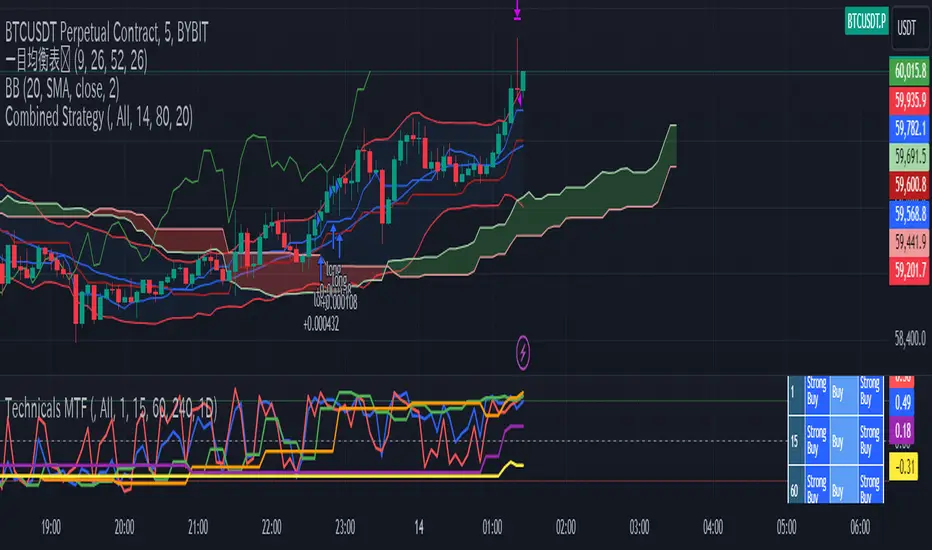
This indicator, titled "Super Technical Ratings," is designed to provide a multi-timeframe technical analysis based on Moving Averages (MAs) and Oscillators. It offers a comprehensive view by evaluating the strength of buy and sell signals across multiple timeframes, displaying these evaluations both visually on the chart and in a table format.
I know that Technical Ratings is one of the most excellent indicators, but it’s also true that trends can often be misread due to the influence of other timeframes. Especially on shorter timeframes, there can be sudden price movements influenced by trends in longer timeframes. While it’s important to check other timeframes, switching between charts can be very cumbersome. I created this indicator with the hope of being able to check the Technical Ratings across multiple timeframes on a single screen. It goes without saying, I recommend displaying it as lines rather than histograms.
Key Features:
1. **Multi-Timeframe Analysis:**
- The indicator evaluates technical ratings on five different timeframes: 60 minutes, 240 minutes, 1 day, 1 week, and 1 month.
- Each timeframe is individually analyzed using a combination of Moving Averages and Oscillators, or either one depending on the user’s settings.
2. **Technical Ratings Calculation:**
- The ratings are based on the overall combination of MAs and Oscillators (`All`), MAs only, or Oscillators only, depending on the user's selection.
- The rating results are categorized into five statuses: "Strong Buy," "Buy," "Neutral," "Sell," and "Strong Sell."
3. **Table Display:**
- A table is generated on the chart to show the technical ratings for each timeframe. The table columns display the timeframe and the corresponding ratings for MAs, Oscillators, and their combination.
- The table cells are color-coded based on the rating, making it easy to quickly identify strong buy or sell signals.
4. **Graphical Plotting:**
- The indicator plots the technical rating signals for each timeframe on the chart. Different colors are used for each timeframe to help distinguish between them.
- Horizontal lines are plotted at 0, +0.5, and -0.5 levels to indicate key thresholds, making it easier to interpret the strength of the signals.
5. **Alert Conditions:**
- The indicator can trigger alerts when the technical rating crosses certain thresholds (e.g., moving from a neutral rating to a buy or sell rating).
- This helps users stay informed of significant changes in the market conditions.
Use Case:
This indicator is particularly useful for traders who want to see a consolidated view of technical ratings across multiple timeframes. It allows for a quick assessment of whether a security is generally considered a buy or sell across different time periods, aiding in making more informed trading decisions. The visual representation, combined with the color-coded table, provides an intuitive way to understand the current market sentiment.
Mã nguồn mở
Theo đúng tinh thần TradingView, tác giả của tập lệnh này đã công bố nó dưới dạng mã nguồn mở, để các nhà giao dịch có thể xem xét và xác minh chức năng. Chúc mừng tác giả! Mặc dù bạn có thể sử dụng miễn phí, hãy nhớ rằng việc công bố lại mã phải tuân theo Nội quy.
Thông báo miễn trừ trách nhiệm
Thông tin và các ấn phẩm này không nhằm mục đích, và không cấu thành, lời khuyên hoặc khuyến nghị về tài chính, đầu tư, giao dịch hay các loại khác do TradingView cung cấp hoặc xác nhận. Đọc thêm tại Điều khoản Sử dụng.