OPEN-SOURCE SCRIPT
Trade Tool VDWMA + OI RSI Based
This indicator works only for symbols where open interest data is available.
The idea was to create a combination of Volume Delta, Open Interest, RSI, Moving Average and Support / Resistance as a unified tool.
I created a Weighted Moving Average based on the Volume Delta (VDWMA). The idea behind this was to reflect the moving average on the difference between buy and sell volume.
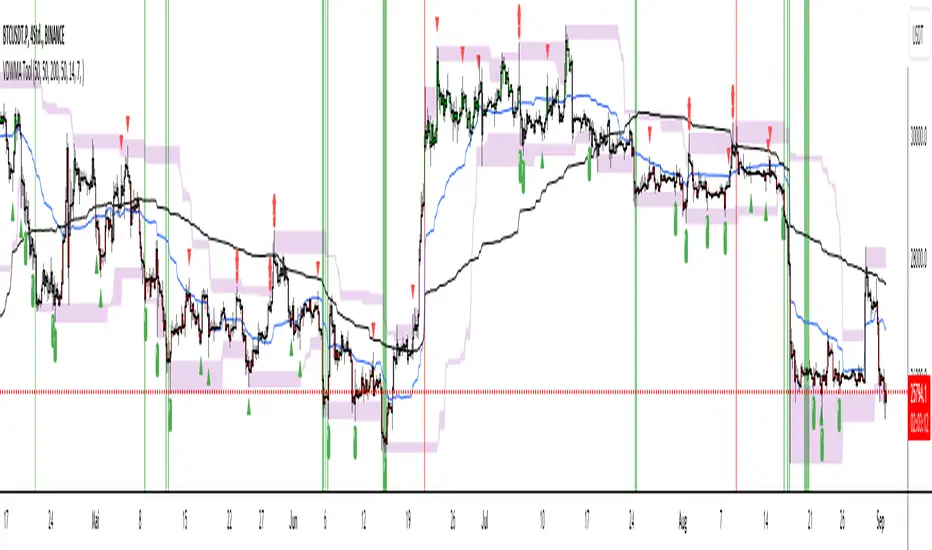
There are two VDWMA to determine a trend. Fast and Slow. The principle is the same as with conventional moving averages. For visualization, the candles are colored based on the following logic:
up trend = Fast VDWMA is above the Slow VDWMA and the price is above the Fast VWDWMA.
down Trend = Fast VDWMA is below the Slow VDWMA and the Short is below the Fast VDWMA
Further, support and resistance zones were defined based on the close and high prices as well as close and low prices.
A simple logic looks for divergences between RSI and price to generate first signals for possible price reversals.
Another RSI was created based on the open interest.
In combination with the conventional RSI, oversold and overbought zones were defined based on the following logic, which are marked by vertical zones on the chart.
Oversold zone = RSI is below 30 and OI RSI is above 70 or below 30 and OI opening is not greater than OI closing price
Overbought zone = RSI is above 70 and OI RSI is above 70 or below 30 and OI opening is not smaller than OI closing price
Based on this, buy and sell signals were defined.
First, the support or resistance zone must remain the same for two candles, which signals that the zone has not been breached. In addition, a divergence must occur in the RSI and the price must bounce.
newsell = resistance[1] == resistance and high >= resistance and close < resistance and bearishDiv
newbull = support[1] == support and low <= support and close > support and bullishDiv
The OI signaling was deliberately not included as well as the trend function. The tool should be suitable for scalping as well as for swinging. Thus, depending on the tradestyle itself to decide which points you want to trade.
Have fun with it
The idea was to create a combination of Volume Delta, Open Interest, RSI, Moving Average and Support / Resistance as a unified tool.
I created a Weighted Moving Average based on the Volume Delta (VDWMA). The idea behind this was to reflect the moving average on the difference between buy and sell volume.
There are two VDWMA to determine a trend. Fast and Slow. The principle is the same as with conventional moving averages. For visualization, the candles are colored based on the following logic:
up trend = Fast VDWMA is above the Slow VDWMA and the price is above the Fast VWDWMA.
down Trend = Fast VDWMA is below the Slow VDWMA and the Short is below the Fast VDWMA
Further, support and resistance zones were defined based on the close and high prices as well as close and low prices.
A simple logic looks for divergences between RSI and price to generate first signals for possible price reversals.
Another RSI was created based on the open interest.
In combination with the conventional RSI, oversold and overbought zones were defined based on the following logic, which are marked by vertical zones on the chart.
Oversold zone = RSI is below 30 and OI RSI is above 70 or below 30 and OI opening is not greater than OI closing price
Overbought zone = RSI is above 70 and OI RSI is above 70 or below 30 and OI opening is not smaller than OI closing price
Based on this, buy and sell signals were defined.
First, the support or resistance zone must remain the same for two candles, which signals that the zone has not been breached. In addition, a divergence must occur in the RSI and the price must bounce.
newsell = resistance[1] == resistance and high >= resistance and close < resistance and bearishDiv
newbull = support[1] == support and low <= support and close > support and bullishDiv
The OI signaling was deliberately not included as well as the trend function. The tool should be suitable for scalping as well as for swinging. Thus, depending on the tradestyle itself to decide which points you want to trade.
Have fun with it
Mã nguồn mở
Theo đúng tinh thần TradingView, tác giả của tập lệnh này đã công bố nó dưới dạng mã nguồn mở, để các nhà giao dịch có thể xem xét và xác minh chức năng. Chúc mừng tác giả! Mặc dù bạn có thể sử dụng miễn phí, hãy nhớ rằng việc công bố lại mã phải tuân theo Nội quy.
Thông báo miễn trừ trách nhiệm
Thông tin và các ấn phẩm này không nhằm mục đích, và không cấu thành, lời khuyên hoặc khuyến nghị về tài chính, đầu tư, giao dịch hay các loại khác do TradingView cung cấp hoặc xác nhận. Đọc thêm tại Điều khoản Sử dụng.