CVD Line + EMA
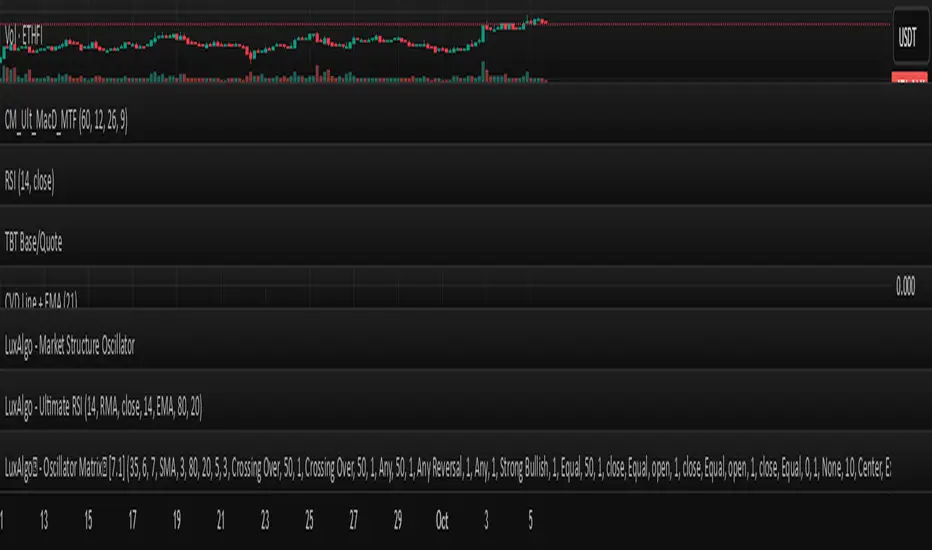
Settings allow users to customize the EMA period to suit different timeframes or trading strategies. The script is intended for educational purposes and is released under the Mozilla Public License 2.0. For best results, use in conjunction with other analysis and risk management tools.
Tập lệnh chỉ hiển thị cho người được mời
Chỉ những người dùng được tác giả đồng ý mới có thể truy cập tập lệnh này. Bạn cần yêu cầu và xin phép sử dụng tập lệnh này. Quyền truy cập thường được cấp sau khi thanh toán. Để biết thêm chi tiết, hãy làm theo hướng dẫn của tác giả bên dưới hoặc liên hệ trực tiếp với MFH_BM.
TradingView KHÔNG khuyến khích trả tiền hoặc sử dụng tập lệnh trừ khi bạn hoàn toàn tin tưởng tác giả và hiểu cách hoạt động của tập lệnh. Bạn cũng có thể tìm thấy các giải pháp thay thế miễn phí, mã nguồn mở trong mục tập lệnh cộng đồng của chúng tôi.
Hướng dẫn của tác giả
Thông báo miễn trừ trách nhiệm
Tập lệnh chỉ hiển thị cho người được mời
Chỉ những người dùng được tác giả đồng ý mới có thể truy cập tập lệnh này. Bạn cần yêu cầu và xin phép sử dụng tập lệnh này. Quyền truy cập thường được cấp sau khi thanh toán. Để biết thêm chi tiết, hãy làm theo hướng dẫn của tác giả bên dưới hoặc liên hệ trực tiếp với MFH_BM.
TradingView KHÔNG khuyến khích trả tiền hoặc sử dụng tập lệnh trừ khi bạn hoàn toàn tin tưởng tác giả và hiểu cách hoạt động của tập lệnh. Bạn cũng có thể tìm thấy các giải pháp thay thế miễn phí, mã nguồn mở trong mục tập lệnh cộng đồng của chúng tôi.