OPEN-SOURCE SCRIPT
Cập nhật KINSKI RSI Short/Long

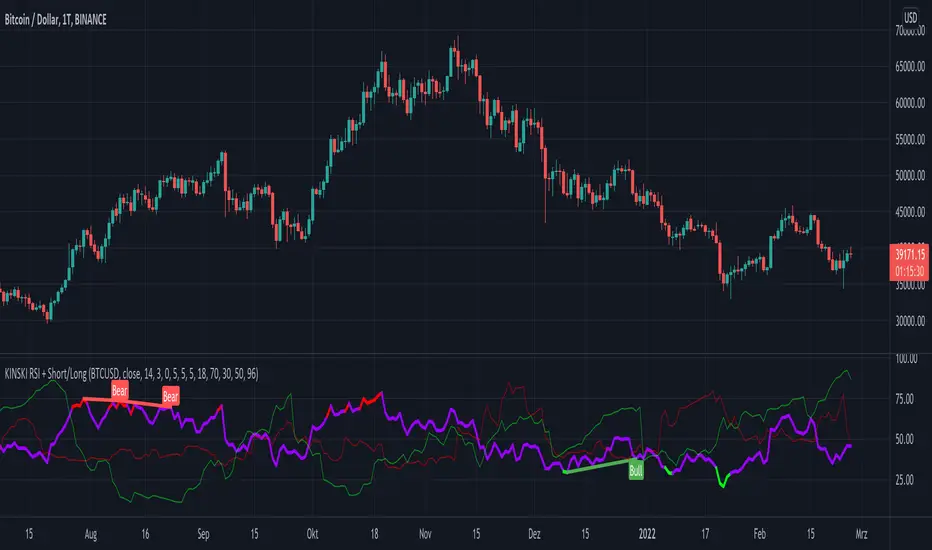
Extends the display of the Relative Strength Index (RSI) by shorts and longs from Bitmex and shows them as a diagram.
How to interpret the display?
- blue line is the default Relative Strength Index
- red line means "oversold
- green line "overbought"
- grey dotted line up/down indicates the optimal range for up and down movements 30 to 70
- in general, the reaching or crossing of the thresholds in the direction of the mid-range is seen as a possible buy or sell signal
- RSI values (blue line) of over 70 percent are considered "overbought", values below 30 percent "oversold
Which settings can be made?
- Selection for the "Currency". Default value is "BTCUSD". Currently only the following currencies are supported "BTCUSD", "ETHUSD", "ETCUSD", "OMGUSD", "XLMUSD", "XTZUSD".
- Selection for calculation formula ("Calculation"). The default value is "hlc3".
- Field for the moving average value ("RSI Length"). The default value is 14, but values of 7, 9 or 25 are also common. The shorter the period under consideration, the more volatile the indicator is, but with longer periods, fewer signals are triggered.
- furthermore you can make layout adjustments via the "Style" menu
Phát hành các Ghi chú
- extend the supported currencies: "BTCUSD", "ETHUSD", "ETCUSD", "EOSUSD", "IOTUSD", "LTCUSD", "OMGUSD", "XRPUSD", "XMRUSD", "XLMUSD", "XTZUSD", "ZECUSD"
- changed the styling for Overbought and Oversold lines
Hint
the description text for red and green line is wrong. here now the correct description:
- red line indicates the number of SHORTS. Line up/down means many/less.
- green line indicates the number of LONGS. Line up/down means many/less.
Phát hành các Ghi chú
- Display optimized for RSI line. Overbought zone (shows a possible sell-signal) is shown in red. Oversold zone (shows a possible buy signal) is displayed in green.
Phát hành các Ghi chú
- removed no more needed Option "Up/Down Movements: On/Off"
Phát hành các Ghi chú
- PineScript 4 compatibility increased. Deprecated attribute "transp" replaced by function color.new()Phát hành các Ghi chú
- Convert to PineScript5
- add optional Divergence Identification (enabled by default)
Phát hành các Ghi chú
- Code optimization: define type "color"
Mã nguồn mở
Theo đúng tinh thần TradingView, tác giả của tập lệnh này đã công bố nó dưới dạng mã nguồn mở, để các nhà giao dịch có thể xem xét và xác minh chức năng. Chúc mừng tác giả! Mặc dù bạn có thể sử dụng miễn phí, hãy nhớ rằng việc công bố lại mã phải tuân theo Nội quy.
My published Scripts:
de.tradingview.com/u/KINSKI/
Appreciation of my work: paypal.com/paypalme/steffenhollstein
de.tradingview.com/u/KINSKI/
Appreciation of my work: paypal.com/paypalme/steffenhollstein
Thông báo miễn trừ trách nhiệm
Thông tin và các ấn phẩm này không nhằm mục đích, và không cấu thành, lời khuyên hoặc khuyến nghị về tài chính, đầu tư, giao dịch hay các loại khác do TradingView cung cấp hoặc xác nhận. Đọc thêm tại Điều khoản Sử dụng.