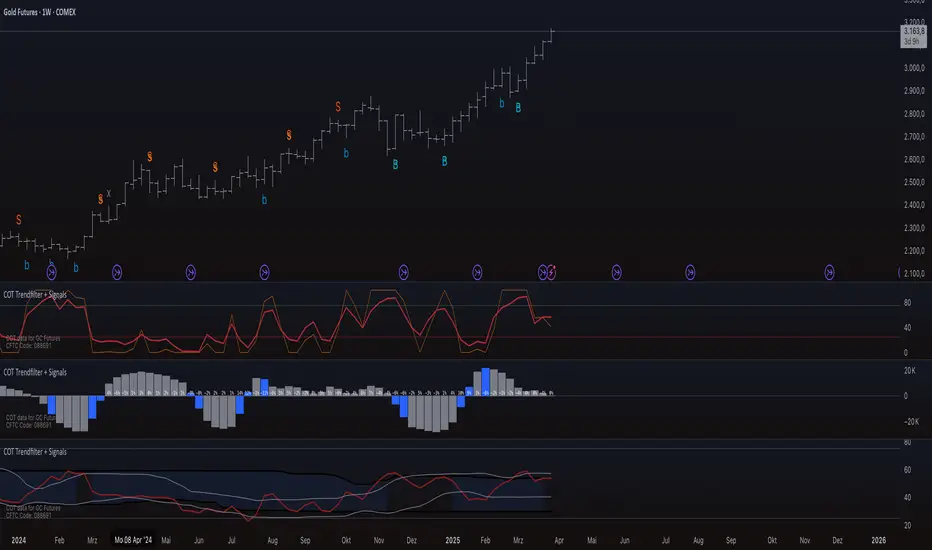
COT Trendfilter + Signals
Data Processing and Usage: The COT indicator processes Commitments of Traders (COT) data provided by the CFTC. Users can select from various participant groups, including Commercials, Large Speculators, and Small Speculators. However, it is important to note that the signal logic of the indicator is exclusively applicable to the net positions of Commercials. This is because Commercials tend to trade contrarily, meaning their trading decisions often run against the prevailing market trend.
Functionality of the Indicators
1. Cycle COT
The cCOT is an enhanced version of the classic RSI. It incorporates additional smoothing based on market vibrations, along with adaptive upper and lower bands based on cyclical memory. The cCOT uses the current dominant cycle length as input and highlights trading signals when the signal line crosses above or below the adaptive bands. Compared to the standard RSI, the cCOT responds more quickly to market movements.
For detailed information on the cCOT, please refer to Chapter 4 "Fine tuning technical indicators" in the book "Decoding the Hidden Market Rhythm, Part 1" by Lars von Thienen.
2. Adaptive Ultra-Smooth Momentum Indicator
The Adaptive Ultra-Smooth Momentum Indicator (CSI) provides an optimized momentum oscillator based on the current dominant cycle. It addresses three common issues with standard indicators: excessive false signals, signal delay, and the need for length adjustments. The CSI offers adaptive smoothing, zero delay, and accurate detection of turning points.
For further information about the CSI, please refer to Chapter 10 "Cycle Swing Indicator: Trading the swing of the dominant cycle" in the book "Decoding the Hidden Market Rhythm, Part 1" by Lars von Thienen.
Signals and Validation
The indicator generates various trading signals:
cCOT:
A buy signal is indicated by an airplane emoji (🛫), while a sell signal is marked by another airplane emoji (🛬).
COT Momentum:
A buy signal is shown by the symbol “∿” in green, while a sell signal is represented by the same symbol in red.
Standard COT Index (Willco):
A buy signal is depicted by a “B” (in green), while a sell signal is shown by an “S” (in red).
Additionally, the validity of the signals is checked. If a previous signal becomes invalid in the following week, it is marked with a gray “x,” indicating that these signals may not be reliable. Users can also switch between net positions, long, and short to analyze the most relevant data for them.
Background Color
The color in the channel can indicate the strength of the Commercials' long-term trend. A channel background color signals an active long-, short-term trend, while no color suggests that there is no clear long-term trend present.
Strange behavior
When only a sharp spike is displayed and the rest is flat, the length settings of the Cycle Length Index should be increased. This can occur when the length is too short, resulting in an unusual spike to properly generate the channel.
Disclaimer
The use of this indicator and the generated signals is at your own risk. The author assumes no responsibility for trading decisions made based on these signals. Please be aware that trading financial instruments involves risks.
2. Indicator = COT Momentum
The weekly fluctuations in COT data can now be analyzed in greater detail using Bollinger Bands. The momentum has been enhanced to visually highlight percentage changes exceeding a specified threshold (e.g., X%) with a blue color for easier interpretation.
Additionally, buy and sell signals derived from the standard COT Index 1 and 2 can now be marked visually, allowing for a more intuitive analysis. Users can leverage extreme values, such as 75 or 25, as well as the upper and lower Bollinger Bands, to identify potential buy or sell opportunities.
Unfortunately, the index is currently inaccurate for the following futures because TradingView did not fully update the data earlier this year. Two weeks of data are missing, which prevents the index from calculating the correct value.
Also the Open Interest is available again.
The first Cycle Index Length is now with length of 8 and uses 75 and 25 instead of the cyclic band. The second Cycle Index Length is with length of 26 and uses the cyclic low and high Band.
Removed the COT Single from the Momentum Indicator.
Added percentage change in Open Interest as a color-based visualization + the Open Interest Change to previous week as a number.
added Open Interest Change Table – Track Open Interest Changes Over a Customizable Period
This indicator calculates the percentage change in Open Interest (OI) over a user-defined period. Instead of focusing on price data, it exclusively analyzes Open Interest, which is a key volume indicator in futures and derivatives markets.
Key Features:
Customizable Time Period – Users can define the start and end dates for the calculation. By default, the indicator measures OI change over the last 26 weeks.
Interactive Adjustment – The time range can be adjusted directly on the chart using a slider, providing a dynamic and user-friendly experience.
Table Display – The Open Interest change is presented in a clear and structured table in the bottom right corner of the chart, rather than as a label overlay.
Percentage-Based Calculation – The indicator calculates the percentage change in Open Interest between the start and end of the selected period.
Use Cases:
Trend Confirmation – Increasing Open Interest alongside a price trend can indicate strong market participation.
Accumulation and Distribution Analysis – A declining Open Interest may suggest position closures, while an increase can signal new capital entering the market.
Market Strength Assessment – Changes in Open Interest help identify whether a market is driven by speculative traders or institutional investors.
Tập lệnh chỉ hiển thị cho người được mời
Chỉ những người dùng được tác giả chấp thuận mới có thể truy cập tập lệnh này. Bạn sẽ cần yêu cầu và được cấp quyền sử dụng. Thông thường quyền này được cấp sau khi thanh toán. Để biết thêm chi tiết, làm theo hướng dẫn của tác giả bên dưới hoặc liên hệ trực tiếp với ComJoTrader.
TradingView KHÔNG khuyến nghị bạn trả phí hoặc sử dụng một tập lệnh trừ khi bạn hoàn toàn tin tưởng vào tác giả và hiểu cách hoạt động của tập lệnh. Bạn cũng có thể tìm các lựa chọn miễn phí, mã nguồn mở trong các script cộng đồng của chúng tôi.
Hướng dẫn của tác giả
Thông báo miễn trừ trách nhiệm
Tập lệnh chỉ hiển thị cho người được mời
Chỉ những người dùng được tác giả chấp thuận mới có thể truy cập tập lệnh này. Bạn sẽ cần yêu cầu và được cấp quyền sử dụng. Thông thường quyền này được cấp sau khi thanh toán. Để biết thêm chi tiết, làm theo hướng dẫn của tác giả bên dưới hoặc liên hệ trực tiếp với ComJoTrader.
TradingView KHÔNG khuyến nghị bạn trả phí hoặc sử dụng một tập lệnh trừ khi bạn hoàn toàn tin tưởng vào tác giả và hiểu cách hoạt động của tập lệnh. Bạn cũng có thể tìm các lựa chọn miễn phí, mã nguồn mở trong các script cộng đồng của chúng tôi.