OPEN-SOURCE SCRIPT
FVE (Volatility Modified)
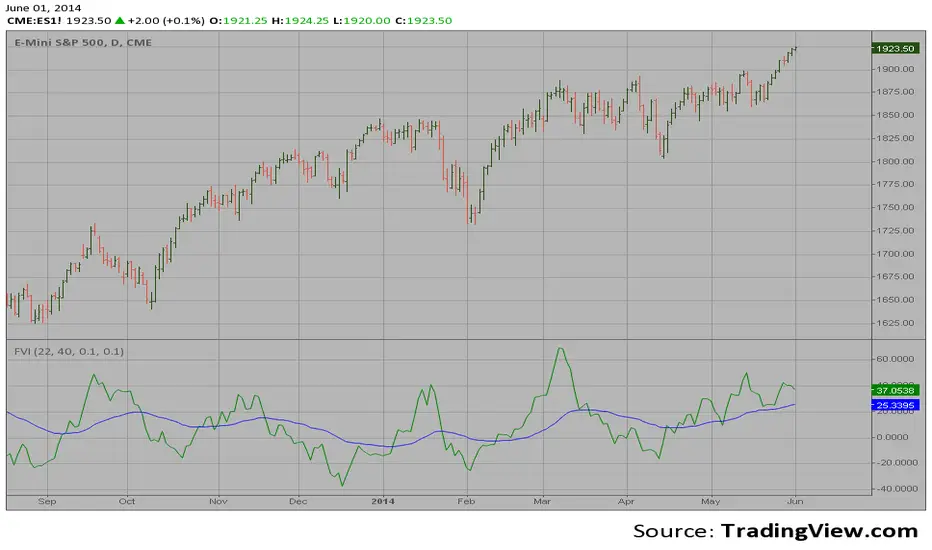
This is another version of FVE indicator that we have posted earlier
in this forum.
This version has an important enhancement to the previous one that`s
especially useful with intraday minute charts.
Due to the volatility had not been taken into account to avoid the extra
complication in the formula, the previous formula has some drawbacks:
The main drawback is that the constant cutoff coefficient will overestimate
price changes in minute charts and underestimate corresponding changes in
weekly or monthly charts.
And now the indicator uses adaptive cutoff coefficient which will adjust to
all time frames automatically.
Mã nguồn mở
Theo đúng tinh thần TradingView, tác giả của tập lệnh này đã công bố nó dưới dạng mã nguồn mở, để các nhà giao dịch có thể xem xét và xác minh chức năng. Chúc mừng tác giả! Mặc dù bạn có thể sử dụng miễn phí, hãy nhớ rằng việc công bố lại mã phải tuân theo Nội quy.
Bài đăng liên quan
Thông báo miễn trừ trách nhiệm
Thông tin và các ấn phẩm này không nhằm mục đích, và không cấu thành, lời khuyên hoặc khuyến nghị về tài chính, đầu tư, giao dịch hay các loại khác do TradingView cung cấp hoặc xác nhận. Đọc thêm tại Điều khoản Sử dụng.