OPEN-SOURCE SCRIPT
Price Relative / Relative Strength Comparative [NeoButane]
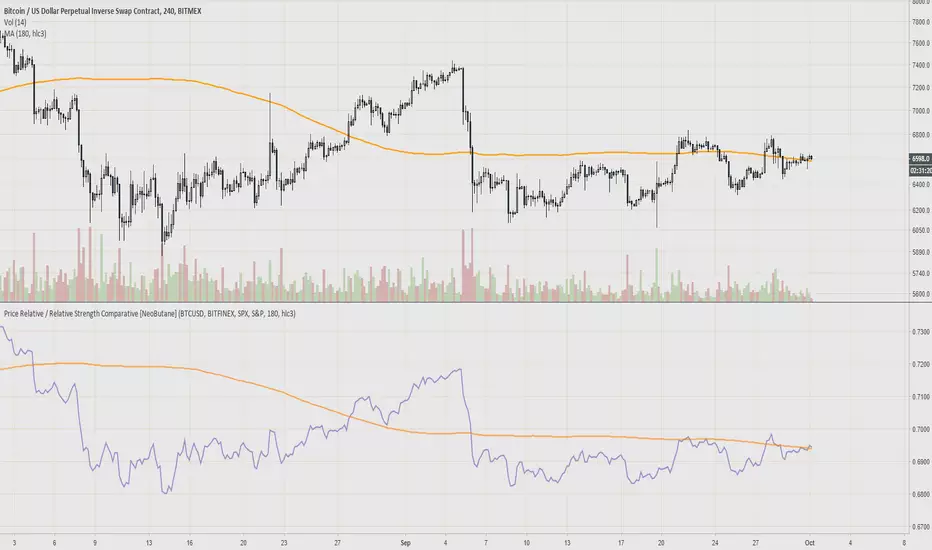
"The Price Relative indicator compares the performance of one security to another with a ratio chart."
Divergences and chart patterns can apply to this ratio.
This was created because I wanted to compare bitcoin to currency/stock indices. So far I've seen mostly confluence with cryptos. Comparing stocks against market indices better shows where the index begins to outperform the stock before price action can reveal dips in price. Using same length moving averages or divergences can help spot that.
There's a glitch where candle colors turn blue when editing. Turn the candles on and off to fix it.
Reference: stockcharts.com/school/doku.php?id=chart_school:technical_indicators:price_relative
Formula:
Price Relative = Base Security / Comparative Security
Ratio Symbol Close = Close of First Symbol / Close of Second Symbol
Ratio Symbol Open = Open of First Symbol / Close of Second Symbol
Ratio Symbol High = High of First Symbol / Close of Second Symbol
Ratio Symbol Low = Low of First Symbol / Close of Second Symbol
Note: Although StockCharts states
"Base Security / Comparative Security"
I've used
"Base Security / (Base Security + Comparative Security)
to create a ratio as the article has stated it should be.
Possible use: margin/CVD
Mã nguồn mở
Theo đúng tinh thần TradingView, tác giả của tập lệnh này đã công bố nó dưới dạng mã nguồn mở, để các nhà giao dịch có thể xem xét và xác minh chức năng. Chúc mừng tác giả! Mặc dù bạn có thể sử dụng miễn phí, hãy nhớ rằng việc công bố lại mã phải tuân theo Nội quy.
My published indicators: tradingview.com/u/NeoButane/
Sorry if I haven't replied to your message yet, I'm a bit backlogged :)
Sorry if I haven't replied to your message yet, I'm a bit backlogged :)
Thông báo miễn trừ trách nhiệm
Thông tin và các ấn phẩm này không nhằm mục đích, và không cấu thành, lời khuyên hoặc khuyến nghị về tài chính, đầu tư, giao dịch hay các loại khác do TradingView cung cấp hoặc xác nhận. Đọc thêm tại Điều khoản Sử dụng.