OPEN-SOURCE SCRIPT
Cập nhật 10 Minute Futures Session Open Range
Inspired by SamRecio's 30sec OR script.
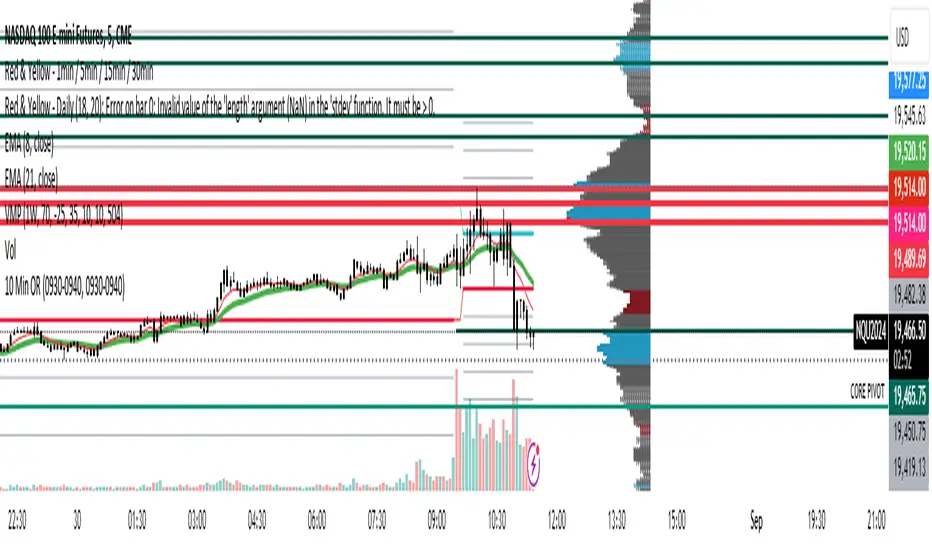
The 10 minute Opening Range (OR) dynamically identifies and visualizes the opening range of a trading session within the first 10 minutes after the market opens at 9:30 AM EST, concluding at 4:00 PM EST, reflecting the typical trading hours for U.S. stock exchanges. This indicator is particularly useful for strategies that rely on the initial market momentum and direction established during the early moments of the trading session.
Upon activation, the indicator calculates the highest (orHigh) and lowest (orLow) price levels reached during the first 10 minutes of the trading session, marking these levels with green (for the high) and red (for the low) lines directly on the chart overlay. Additionally, it computes and plots a midpoint (midPoint) between these high and low levels, displayed as a blue line, offering a visual reference for the median of the opening range.
The calculations are reset daily to ensure the indicator accurately reflects the opening range for each new trading session. By doing so, it avoids carrying over data from previous days, maintaining relevance and precision for day traders and those utilizing short-term trading strategies. The indicator also incorporates timezone adjustments to align with the America/New_York timezone, ensuring that the opening range is accurately captured regardless of the user's local timezone.
This tool is invaluable for traders looking to capitalize on breakout or reversion strategies around the opening range, providing clear visual cues for significant price levels established at the start of the trading session. By focusing on the first 10 minutes of trading, it caters to a specific segment of the market that believes the initial movements can set the tone for the rest of the day's trading activity.
Phát hành các Ghi chú
Updated Previous Version to include extension targets (credit to MichiganDolf)The 10 minute Opening Range (OR) dynamically identifies and visualizes the opening range of a trading session within the first 10 minutes after the market opens at 9:30 AM EST, concluding at 4:00 PM EST, reflecting the typical trading hours for U.S. stock exchanges. This indicator is particularly useful for strategies that rely on the initial market momentum and direction established during the early moments of the trading session.
Upon activation, the indicator calculates the highest (orHigh) and lowest (orLow) price levels reached during the first 10 minutes of the trading session, marking these levels with green (for the high) and red (for the low) lines directly on the chart overlay. Additionally, it computes and plots a midpoint (midPoint) between these high and low levels, displayed as a blue line, offering a visual reference for the median of the opening range.
The calculations are reset daily to ensure the indicator accurately reflects the opening range for each new trading session. By doing so, it avoids carrying over data from previous days, maintaining relevance and precision for day traders and those utilizing short-term trading strategies. The indicator also incorporates timezone adjustments to align with the America/New_York timezone, ensuring that the opening range is accurately captured regardless of the user's local timezone.
This tool is invaluable for traders looking to capitalize on breakout or reversion strategies around the opening range, providing clear visual cues for significant price levels established at the start of the trading session. By focusing on the first 10 minutes of trading, it caters to a specific segment of the market that believes the initial movements can set the tone for the rest of the day's trading activity.
Phát hành các Ghi chú
Fixed timeframe selection changing the opening range. Static now across all timeframesMã nguồn mở
Theo đúng tinh thần TradingView, tác giả của tập lệnh này đã công bố nó dưới dạng mã nguồn mở, để các nhà giao dịch có thể xem xét và xác minh chức năng. Chúc mừng tác giả! Mặc dù bạn có thể sử dụng miễn phí, hãy nhớ rằng việc công bố lại mã phải tuân theo Nội quy.
Thông báo miễn trừ trách nhiệm
Thông tin và các ấn phẩm này không nhằm mục đích, và không cấu thành, lời khuyên hoặc khuyến nghị về tài chính, đầu tư, giao dịch hay các loại khác do TradingView cung cấp hoặc xác nhận. Đọc thêm tại Điều khoản Sử dụng.
Mã nguồn mở
Theo đúng tinh thần TradingView, tác giả của tập lệnh này đã công bố nó dưới dạng mã nguồn mở, để các nhà giao dịch có thể xem xét và xác minh chức năng. Chúc mừng tác giả! Mặc dù bạn có thể sử dụng miễn phí, hãy nhớ rằng việc công bố lại mã phải tuân theo Nội quy.
Thông báo miễn trừ trách nhiệm
Thông tin và các ấn phẩm này không nhằm mục đích, và không cấu thành, lời khuyên hoặc khuyến nghị về tài chính, đầu tư, giao dịch hay các loại khác do TradingView cung cấp hoặc xác nhận. Đọc thêm tại Điều khoản Sử dụng.