OPEN-SOURCE SCRIPT
Line Strategy v6
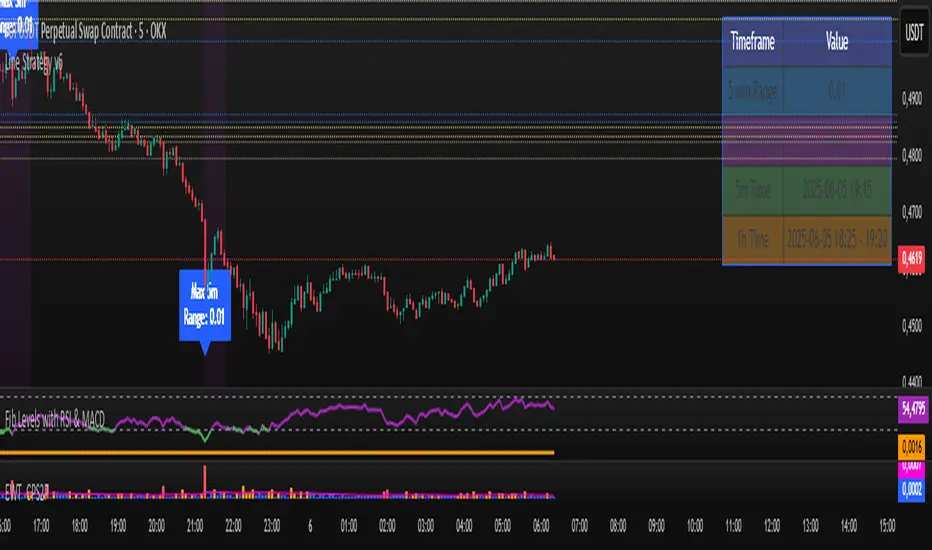
Line Indicator for TradingView
This Pine Script indicator identifies the largest candles on both 5-minute and 1-hour timeframes within the last 240 five-minute bars. It provides visual markers and detailed information to help traders spot significant price movements.
Key Features
Dual Timeframe Analysis:
Identifies largest candle on 5-minute timeframe
Identifies largest candle on 1-hour timeframe (aggregated from 12 five-minute candles)
Visual Markers:
Blue label marks the highest-range 5-minute candle
Purple background highlights the highest-range hourly candle period
Information Table:
Shows price ranges for both timeframes
Displays precise timestamps for identified candles
Color-coded for quick reference
Progress Indicator:
Shows how many bars have been collected (out of 240 required)
How It Works
Data Collection:
Stores high, low, timestamp, and bar index of the last 240 five-minute candles
Automatically updates with each new bar
5-Minute Analysis:
Scans all 5-minute candles to find the one with the largest price range (high - low)
Marks this candle with a blue label showing its range
Hourly Analysis:
Groups 12 five-minute candles to form each hourly candle
Finds the hourly candle with the largest price range
Highlights the entire hour period with a purple background
Information Display:
Creates a table in the top-right corner showing:
Range values for both timeframes
Timestamps of identified candles
Time period of the largest hourly candle
Usage Instructions
Apply the indicator to any 5-minute chart
Wait for the indicator to collect 240 bars (about 20 trading hours)
Results will appear automatically:
Blue label on the largest 5-minute candle
Purple background on the largest hourly candle period
Information table with detailed metrics
Customization Options
You can easily adjust these aspects by modifying the code:
Colors of markers and table cells
Transparency levels of background highlights
Precision of range values displayed
Position of the information table
The indicator is optimized for performance and works in both historical and real-time modes.
Mã nguồn mở
Theo đúng tinh thần TradingView, tác giả của tập lệnh này đã công bố nó dưới dạng mã nguồn mở, để các nhà giao dịch có thể xem xét và xác minh chức năng. Chúc mừng tác giả! Mặc dù bạn có thể sử dụng miễn phí, hãy nhớ rằng việc công bố lại mã phải tuân theo Nội quy.
Thông báo miễn trừ trách nhiệm
Thông tin và các ấn phẩm này không nhằm mục đích, và không cấu thành, lời khuyên hoặc khuyến nghị về tài chính, đầu tư, giao dịch hay các loại khác do TradingView cung cấp hoặc xác nhận. Đọc thêm tại Điều khoản Sử dụng.