OPEN-SOURCE SCRIPT
Cập nhật Aarika RSI
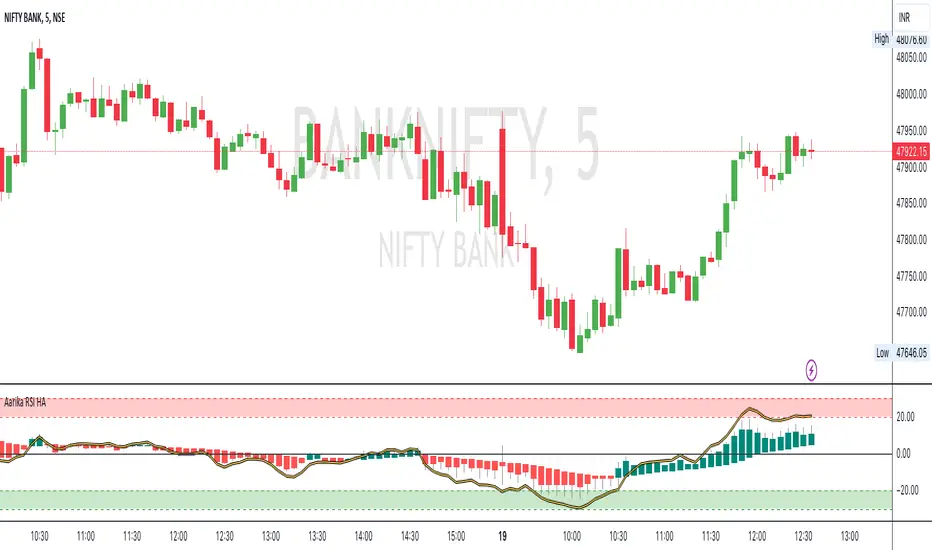
Hello traders, purpose of creating this indicator is simply trying to analyse the trend of any symbol.
This indicator can be used on any script like Indices, Stocks, Future, Currency & Crypto.
This RSI version is much simpler to identify the trend of the script than that of traditional RSI trendline. Rather than showing a line, this RSI indicates bars for better and clear visibility of RSI levels.
This is a modified version of © ParkF. I have modified it to simplest possible manner.
How to trade:
RSI level 80, I consider this as extreme-bought which means high chance if bear market from this point on any given timeframe. Whereas 20 is considered as extreme-sold and have a chance to go higher from the current level.
I recommend you to study this RSI before putting it into practice.
Always start with small target and then go for big one by trailing your profit. This is not a Holy Grail indicator which always gives profit but if you practice this indicator with consistency, your portfolio may give good returns.
Use proper money management for any trade. Go for paper trade and observe how this indicator behaves and once satisfied then only take real trade.
Disclaimer: Please make sure you study this indicator on different timeframes because inserted set of data may act differently on different scripts and may vary from timeframe to timeframe.
We advice you to use this indicator for trend-analysis and study purpose only. Author/publisher of this indicator is not responsible for your profit or loss if you use this indicator for trading purpose one way or another.
N.B.: We do not recommend using HeikinAshi charting for this particular indicator as the data inputs may behave differently than expected. If you have any query, you may comment below.
Phát hành các Ghi chú
Update!Mã nguồn mở
Theo đúng tinh thần TradingView, tác giả của tập lệnh này đã công bố nó dưới dạng mã nguồn mở, để các nhà giao dịch có thể xem xét và xác minh chức năng. Chúc mừng tác giả! Mặc dù bạn có thể sử dụng miễn phí, hãy nhớ rằng việc công bố lại mã phải tuân theo Nội quy.
Thông báo miễn trừ trách nhiệm
Thông tin và các ấn phẩm này không nhằm mục đích, và không cấu thành, lời khuyên hoặc khuyến nghị về tài chính, đầu tư, giao dịch hay các loại khác do TradingView cung cấp hoặc xác nhận. Đọc thêm tại Điều khoản Sử dụng.
Mã nguồn mở
Theo đúng tinh thần TradingView, tác giả của tập lệnh này đã công bố nó dưới dạng mã nguồn mở, để các nhà giao dịch có thể xem xét và xác minh chức năng. Chúc mừng tác giả! Mặc dù bạn có thể sử dụng miễn phí, hãy nhớ rằng việc công bố lại mã phải tuân theo Nội quy.
Thông báo miễn trừ trách nhiệm
Thông tin và các ấn phẩm này không nhằm mục đích, và không cấu thành, lời khuyên hoặc khuyến nghị về tài chính, đầu tư, giao dịch hay các loại khác do TradingView cung cấp hoặc xác nhận. Đọc thêm tại Điều khoản Sử dụng.