Pipnotic Asset Strength Histogram
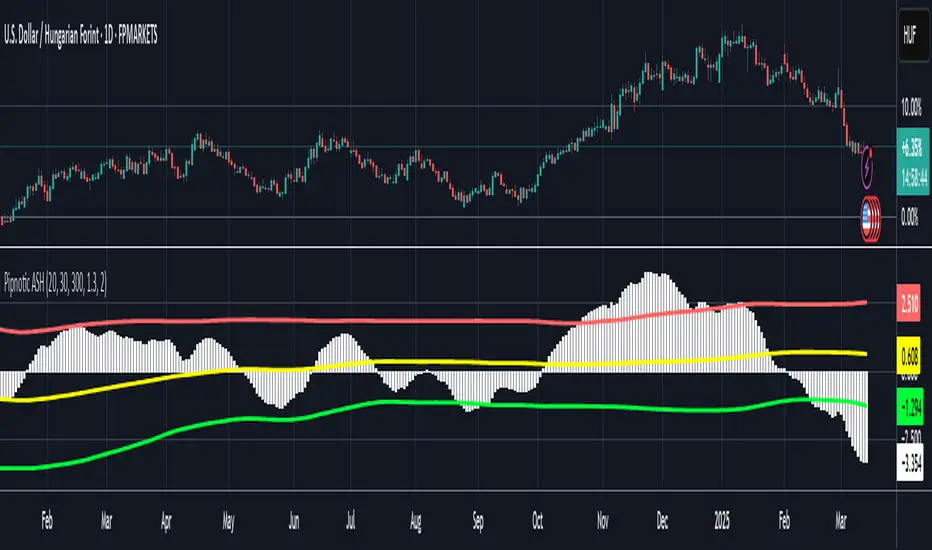
The Pipnotic Asset Strength Histogram (ASH) was originally developed to provide traders with a structured approach to identifying market cycles and momentum shifts. Due to increasing demand, it has been adapted for TradingView, ensuring traders can leverage its insights directly on their charts. This tool is particularly useful for spotting divergences, trend reversals, and price imbalances, making it an essential addition for traders who rely on momentum and strength-based analysis. We will continue to actively develop this indicator to enhance its functionality and accuracy.
How It Works
The ASH follows a systematic approach to analyse price movements and highlight key market dynamics:
Momentum & Cycle Analysis
- Evaluates price movements using a dual-smoothing methodology.
- Identifies shifts in momentum that indicate potential reversals or trend continuations.
Divergence Detection
- Highlights instances where price action diverges from underlying momentum, signalling potential trading opportunities.
- Helps confirm trade setups based on hidden and regular divergences.
Dynamic Visualization & Alerts
- Plots a histogram to provide a clear visual representation of market strength.
- Identifies buy and sell zones based on historical price deviations.
- Updates dynamically, adapting to changing market conditions to maintain relevance.
Key Features & Inputs
- Customizable Sensitivity: Traders can fine-tune cycle smoothing values to match different trading styles.
- Clear Buy & Sell Zones: Highlights potential high-probability trading areas based on historical deviations.
- Flexible Visualization: Adjustable histogram colours, line width, and mean deviation settings for optimal clarity.
- Adaptability Across Markets: Works effectively on stocks, forex, crypto, and commodities.
- Compatible with Various Trading Strategies: Can be used alongside trend-following, breakout, and reversal strategies for enhanced trade confirmation.
Benefits of Using the Pipnotic ASH Indicator
Market Timing: Helps traders identify optimal entry and exit points based on momentum shifts.
Reduces Subjectivity: Automates the detection of market strength and divergence, ensuring consistency.
Adapts to Market Conditions: Adjusts dynamically to price changes, ensuring relevant signals.
Saves Time & Effort: Eliminates the need for manual divergence analysis.
Works on All Timeframes: Suitable for scalping, swing trading, and long-term investing.
The Pipnotic Asset Strength Histogram is designed to streamline market analysis by providing clear, actionable insights into momentum shifts and divergences. Whether you're a day trader or a long-term investor, this tool helps refine your decision-making and enhance your trading strategy.
Tập lệnh chỉ hiển thị cho người được mời
Chỉ những người dùng được tác giả chấp thuận mới có thể truy cập tập lệnh này. Bạn sẽ cần yêu cầu và được cấp quyền sử dụng. Thông thường quyền này được cấp sau khi thanh toán. Để biết thêm chi tiết, làm theo hướng dẫn của tác giả bên dưới hoặc liên hệ trực tiếp với pipnotic.
TradingView KHÔNG khuyến nghị bạn trả phí hoặc sử dụng một tập lệnh trừ khi bạn hoàn toàn tin tưởng vào tác giả và hiểu cách hoạt động của tập lệnh. Bạn cũng có thể tìm các lựa chọn miễn phí, mã nguồn mở trong các script cộng đồng của chúng tôi.
Hướng dẫn của tác giả
Thông báo miễn trừ trách nhiệm
Tập lệnh chỉ hiển thị cho người được mời
Chỉ những người dùng được tác giả chấp thuận mới có thể truy cập tập lệnh này. Bạn sẽ cần yêu cầu và được cấp quyền sử dụng. Thông thường quyền này được cấp sau khi thanh toán. Để biết thêm chi tiết, làm theo hướng dẫn của tác giả bên dưới hoặc liên hệ trực tiếp với pipnotic.
TradingView KHÔNG khuyến nghị bạn trả phí hoặc sử dụng một tập lệnh trừ khi bạn hoàn toàn tin tưởng vào tác giả và hiểu cách hoạt động của tập lệnh. Bạn cũng có thể tìm các lựa chọn miễn phí, mã nguồn mở trong các script cộng đồng của chúng tôi.