OPEN-SOURCE SCRIPT
Cập nhật High/Low Fibs using Bullish Anchors
I do Love me some fibs!!
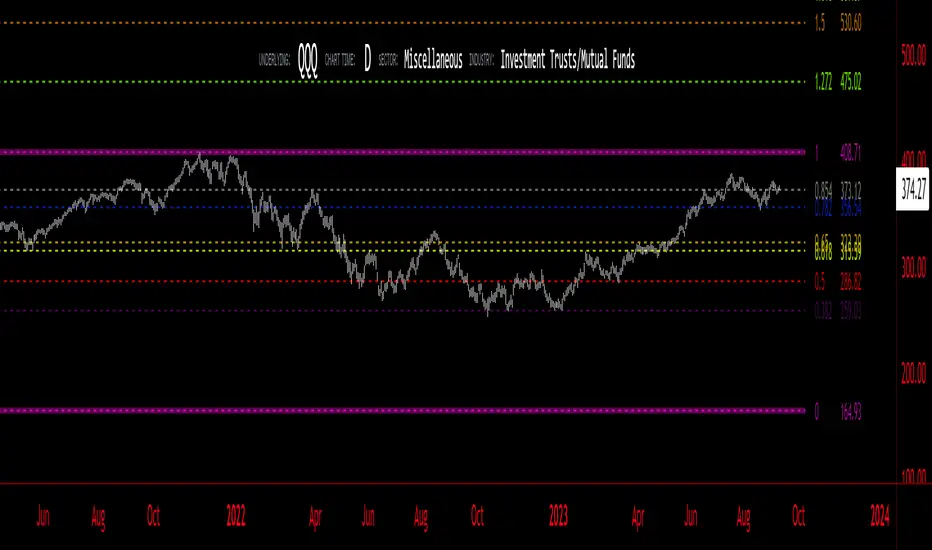
i used a lot of 30 min Opening Range Fibs for interday trading, but have found that using more bars back can make for stronger levels just like when we use higher time frame to see support & resistant levels.
You can just find high and lows for making an easy auto draw fib retracment, I think you will find these to be fairly accurate or at least just entertaining .
Here are some basics on how to use FIb Retracments
Fibonacci retracement is a popular technical analysis tool used by traders to identify potential levels of support and resistance in financial markets, including stocks. It is based on the Fibonacci sequence, a series of numbers where each number is the sum of the two preceding ones (e.g., 0, 1, 1, 2, 3, 5, 8, 13, 21, ...). The key Fibonacci retracement levels are 23.6%, 38.2%, 50%, 61.8%, and 78.6%. These levels are used to identify potential reversal points or areas of price consolidation. Here's how to use Fibonacci retracement in stock trading:
1. Identify a Significant Price Move:
Start by identifying a significant price move in the stock you are analyzing. This move can be either an uptrend or a downtrend. For uptrends, you'll be measuring from the low point to the high point, and for downtrends, you'll measure from the high point to the low point.
2. Draw Fibonacci Levels: *With this indicator We do this for you
Once you have identified the price move, use a Fibonacci retracement tool available on most trading platforms to draw the retracement levels. Typically, you will draw lines from the low point to the high point for uptrends and vice versa for downtrends.
3. Analyze Key Levels:
Pay attention to the key Fibonacci retracement levels, especially the most commonly used ones, which are 38.2%, 50%, and 61.8%. These levels are considered significant in determining potential support and resistance areas. The 23.6% and 78.6% levels are also used but are considered secondary.
4. Look for Confluence:
Consider other technical analysis tools and indicators to look for confluence at these Fibonacci retracement levels. For example, if a 50% retracement level coincides with a moving average or a trendline, it may strengthen the level's significance.
5. Monitor Price Action:
Watch how the stock's price reacts when it approaches these Fibonacci retracement levels. If the price stalls, reverses direction, or shows signs of consolidation around a particular level, it may act as support or resistance.
6. Set Entry and Exit Points:
Based on your analysis, you can set entry and exit points for your trades. Traders often look for buying opportunities near Fibonacci support levels and selling opportunities near resistance levels. Stop-loss orders can be placed just below support or above resistance levels to manage risk.
7. Practice Risk Management:
Always use proper risk management techniques in your trading. This includes setting stop-loss orders, determining your position size, and not risking more than you can afford to lose on a single trade.
8. Monitor Market Conditions:
Be aware that Fibonacci retracement levels are not foolproof and should be used in conjunction with other analysis methods and market conditions. Market sentiment, news events, and economic factors can also influence stock prices.
9. Continuously Learn and Adapt:
As with any trading strategy, it's essential to continuously learn and adapt. Test the effectiveness of Fibonacci retracement levels on different time frames and with different stocks to refine your trading strategy.
**Special Thanks to KioseffTrading for doing most all of the HEAVY LIFTING on the code here... he is beyond a Top G!!
Phát hành các Ghi chú
I do Love me some fibs!! PART TWO So sguido was wanting to be able to change the colors without getting into code... (Buddy I got you 🤛🏼)
Also I wanted to be able to "flip" from Bullish to Bearish... I didnt think i could do it, but with many hours of failure... It has happened... I am working my way to greatness... one line of code at a time...
i used a lot of 30 min Opening Range Fibs for interday trading, but have found that using more bars back can make for stronger levels just like when we use higher time frame to see support & resistant levels.
You can just find high and lows for making an easy auto draw fib retracment, I think you will find these to be fairly accurate or at least just entertaining .
Here are some basics on how to use FIb Retracments
Fibonacci retracement is a popular technical analysis tool used by traders to identify potential levels of support and resistance in financial markets, including stocks. It is based on the Fibonacci sequence, a series of numbers where each number is the sum of the two preceding ones (e.g., 0, 1, 1, 2, 3, 5, 8, 13, 21, ...). The key Fibonacci retracement levels are 23.6%, 38.2%, 50%, 61.8%, and 78.6%. These levels are used to identify potential reversal points or areas of price consolidation. Here's how to use Fibonacci retracement in stock trading:
1. Identify a Significant Price Move:
Start by identifying a significant price move in the stock you are analyzing. This move can be either an uptrend or a downtrend. For uptrends, you'll be measuring from the low point to the high point, and for downtrends, you'll measure from the high point to the low point.
2. Draw Fibonacci Levels: *With this indicator We do this for you
Once you have identified the price move, use a Fibonacci retracement tool available on most trading platforms to draw the retracement levels. Typically, you will draw lines from the low point to the high point for uptrends and vice versa for downtrends.
3. Analyze Key Levels:
Pay attention to the key Fibonacci retracement levels, especially the most commonly used ones, which are 38.2%, 50%, and 61.8%. These levels are considered significant in determining potential support and resistance areas. The 23.6% and 78.6% levels are also used but are considered secondary.
4. Look for Confluence:
Consider other technical analysis tools and indicators to look for confluence at these Fibonacci retracement levels. For example, if a 50% retracement level coincides with a moving average or a trendline, it may strengthen the level's significance.
5. Monitor Price Action:
Watch how the stock's price reacts when it approaches these Fibonacci retracement levels. If the price stalls, reverses direction, or shows signs of consolidation around a particular level, it may act as support or resistance.
6. Set Entry and Exit Points:
Based on your analysis, you can set entry and exit points for your trades. Traders often look for buying opportunities near Fibonacci support levels and selling opportunities near resistance levels. Stop-loss orders can be placed just below support or above resistance levels to manage risk.
7. Practice Risk Management:
Always use proper risk management techniques in your trading. This includes setting stop-loss orders, determining your position size, and not risking more than you can afford to lose on a single trade.
8. Monitor Market Conditions:
Be aware that Fibonacci retracement levels are not foolproof and should be used in conjunction with other analysis methods and market conditions. Market sentiment, news events, and economic factors can also influence stock prices.
9. Continuously Learn and Adapt:
As with any trading strategy, it's essential to continuously learn and adapt. Test the effectiveness of Fibonacci retracement levels on different time frames and with different stocks to refine your trading strategy.
**Special Thanks to KioseffTrading for doing most all of the HEAVY LIFTING on the code here... he is beyond a Top G!!
Phát hành các Ghi chú
Fixed double up on letters/NumbersPhát hành các Ghi chú
- Fixed the double up of lables.Phát hành các Ghi chú
Bug SquishingPhát hành các Ghi chú
- better chart viewPhát hành các Ghi chú
had to go to the big guy to get this bug thank you KioseffTradingPhát hành các Ghi chú
better picMã nguồn mở
Theo đúng tinh thần TradingView, tác giả của tập lệnh này đã công bố nó dưới dạng mã nguồn mở, để các nhà giao dịch có thể xem xét và xác minh chức năng. Chúc mừng tác giả! Mặc dù bạn có thể sử dụng miễn phí, hãy nhớ rằng việc công bố lại mã phải tuân theo Nội quy.
Thông báo miễn trừ trách nhiệm
Thông tin và các ấn phẩm này không nhằm mục đích, và không cấu thành, lời khuyên hoặc khuyến nghị về tài chính, đầu tư, giao dịch hay các loại khác do TradingView cung cấp hoặc xác nhận. Đọc thêm tại Điều khoản Sử dụng.
Mã nguồn mở
Theo đúng tinh thần TradingView, tác giả của tập lệnh này đã công bố nó dưới dạng mã nguồn mở, để các nhà giao dịch có thể xem xét và xác minh chức năng. Chúc mừng tác giả! Mặc dù bạn có thể sử dụng miễn phí, hãy nhớ rằng việc công bố lại mã phải tuân theo Nội quy.
Thông báo miễn trừ trách nhiệm
Thông tin và các ấn phẩm này không nhằm mục đích, và không cấu thành, lời khuyên hoặc khuyến nghị về tài chính, đầu tư, giao dịch hay các loại khác do TradingView cung cấp hoặc xác nhận. Đọc thêm tại Điều khoản Sử dụng.