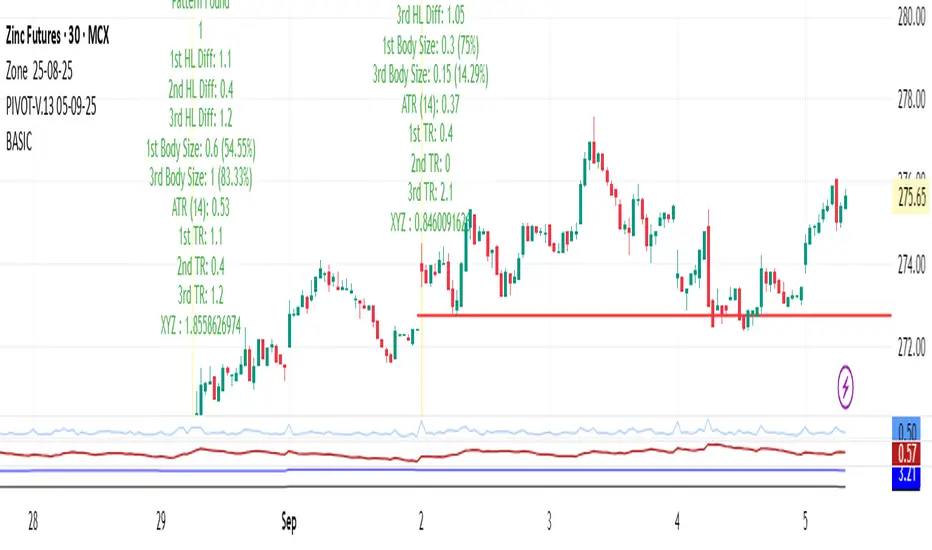
BASIC

---
📊 1. Continuation Patterns
👉 These suggest that the current trend (uptrend or downtrend) will likely continue.
🔹 Flag
Bull Flag → Appears in an uptrend. Sharp upward move (flagpole) followed by a small downward/sideways channel (the flag).
Bear Flag → Opposite, in a downtrend.
📌 Meaning: After the flag consolidation, price usually continues in the original direction.
---
🔹 Pennant
Small symmetrical triangle after a strong move.
Shows temporary pause before trend continuation.
📌 Meaning: Breakout usually follows in the direction of the main trend.
---
🔹 Rectangle
Price moves between parallel support & resistance levels.
Breakout usually happens in the direction of the prevailing trend.
---
📊 2. Reversal Patterns
👉 These suggest that the current trend may reverse direction.
🔹 Head & Shoulders
Looks like a head with two shoulders.
Head & Shoulders Top → Reversal from uptrend to downtrend.
Inverse Head & Shoulders → Reversal from downtrend to uptrend.
📌 Key Level: The “neckline” → breakout confirms reversal.
---
🔹 Double Top & Double Bottom
Double Top → Price tests resistance twice but fails, bearish reversal.
Double Bottom → Price tests support twice but fails, bullish reversal.
---
🔹 Triple Top & Triple Bottom
Same as double but with three tests. Stronger reversal signal.
---
🔹 Rounding Bottom (Saucer)
Price gradually shifts from downtrend to uptrend, looks like a "U" shape.
Very reliable for long-term reversals.
---
📊 3. Neutral / Indecision Patterns
👉 These show uncertainty – direction is confirmed only after breakout.
🔹 Symmetrical Triangle
Price makes lower highs & higher lows (converging).
Breakout can happen either side.
🔹 Ascending Triangle
Flat resistance at top, higher lows forming.
Usually bullish breakout.
🔹 Descending Triangle
Flat support at bottom, lower highs forming.
Usually bearish breakout.
---
✅ Summary for traders:
Continuation = Flag, Pennant, Rectangle.
Reversal = Head & Shoulders, Double/Triple Tops & Bottoms, Rounding Bottom.
Neutral/Indecision = Triangles.
---
Would you like me to make a visual chart image with all these patterns drawn, so you can see how they look on real candlesticks?
Tập lệnh chỉ hiển thị cho người được mời
Chỉ những người dùng được tác giả đồng ý mới có thể truy cập tập lệnh này. Bạn cần yêu cầu và xin phép sử dụng tập lệnh này. Quyền truy cập thường được cấp sau khi thanh toán. Để biết thêm chi tiết, hãy làm theo hướng dẫn của tác giả bên dưới hoặc liên hệ trực tiếp với jatingajjar75.
TradingView KHÔNG khuyến khích trả tiền hoặc sử dụng tập lệnh trừ khi bạn hoàn toàn tin tưởng tác giả và hiểu cách hoạt động của tập lệnh. Bạn cũng có thể tìm thấy các giải pháp thay thế miễn phí, mã nguồn mở trong mục tập lệnh cộng đồng của chúng tôi.
Hướng dẫn của tác giả
Thông báo miễn trừ trách nhiệm
Tập lệnh chỉ hiển thị cho người được mời
Chỉ những người dùng được tác giả đồng ý mới có thể truy cập tập lệnh này. Bạn cần yêu cầu và xin phép sử dụng tập lệnh này. Quyền truy cập thường được cấp sau khi thanh toán. Để biết thêm chi tiết, hãy làm theo hướng dẫn của tác giả bên dưới hoặc liên hệ trực tiếp với jatingajjar75.
TradingView KHÔNG khuyến khích trả tiền hoặc sử dụng tập lệnh trừ khi bạn hoàn toàn tin tưởng tác giả và hiểu cách hoạt động của tập lệnh. Bạn cũng có thể tìm thấy các giải pháp thay thế miễn phí, mã nguồn mở trong mục tập lệnh cộng đồng của chúng tôi.