OPEN-SOURCE SCRIPT
ETH: Supply in Profit Market Bands
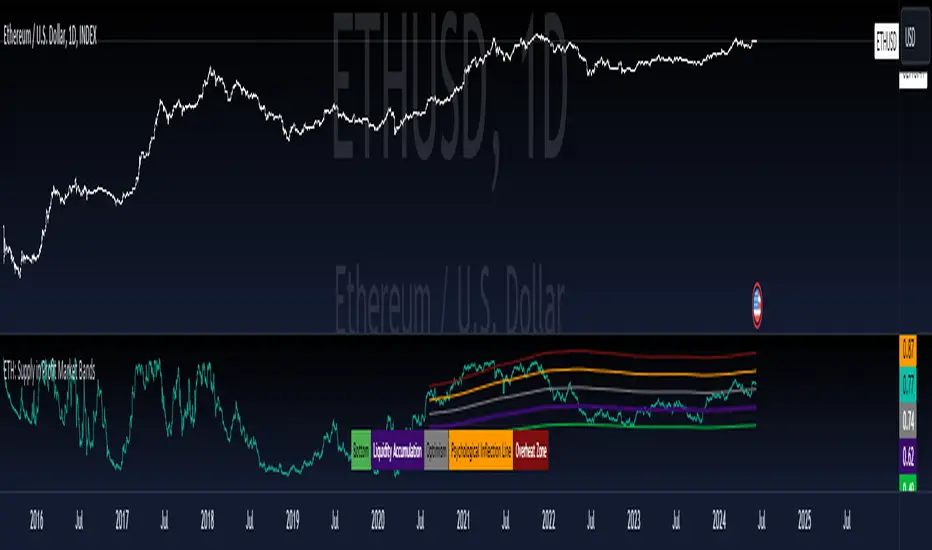
The "ETH: Supply in Profit Market Bands," provides insights into various market bands related to ETH's supply in profit. It visualizes key levels such as liquidity accumulation, bottom, optimism, psychological inflection line, and overheat zone, derived from the historical data of Bitcoin's profit addresses percentage.
The main components of the indicator include:
Supply in Profit: Represents the historical data of Ethereums's supply in profit, plotted as a line graph in the chart.
Additionally, the indicator includes a table that summarizes the legend for each plotted level, providing a clear reference for interpreting the chart. The table displays the legend with corresponding colors for easy identification.
The main components of the indicator include:
Supply in Profit: Represents the historical data of Ethereums's supply in profit, plotted as a line graph in the chart.
- Liquidity Accumulation: Indicates a level derived from a moving average of the profit addresses percentage, highlighting potential areas of liquidity accumulation.
- Bottom: Represents a level indicating the lower boundary or potential support zone in the market.
- Optimism: Reflects a level suggesting optimistic sentiments or potential resistance in the market.
- Psychological Inflection Line: Marks a level that could signal psychological shifts or significant market sentiment changes.
- Overheat Zone: Identifies a level indicating extreme market conditions or potential overbought scenarios.
Additionally, the indicator includes a table that summarizes the legend for each plotted level, providing a clear reference for interpreting the chart. The table displays the legend with corresponding colors for easy identification.
Mã nguồn mở
Theo đúng tinh thần TradingView, người tạo ra tập lệnh này đã biến tập lệnh thành mã nguồn mở để các nhà giao dịch có thể xem xét và xác minh công năng. Xin dành lời khen tặng cho tác giả! Mặc dù bạn có thể sử dụng miễn phí, nhưng lưu ý nếu đăng lại mã, bạn phải tuân theo Quy tắc nội bộ của chúng tôi.
🔍 Access Investing Strategies & Indicators
📊 whop.com/marktquant
🌐 marktquant.com
Nothing shared on this page constitutes financial advice. All information, tools, and analyses are provided solely for informational and educational purposes.
📊 whop.com/marktquant
🌐 marktquant.com
Nothing shared on this page constitutes financial advice. All information, tools, and analyses are provided solely for informational and educational purposes.
Thông báo miễn trừ trách nhiệm
Thông tin và ấn phẩm không có nghĩa là và không cấu thành, tài chính, đầu tư, kinh doanh, hoặc các loại lời khuyên hoặc khuyến nghị khác được cung cấp hoặc xác nhận bởi TradingView. Đọc thêm trong Điều khoản sử dụng.