OPEN-SOURCE SCRIPT
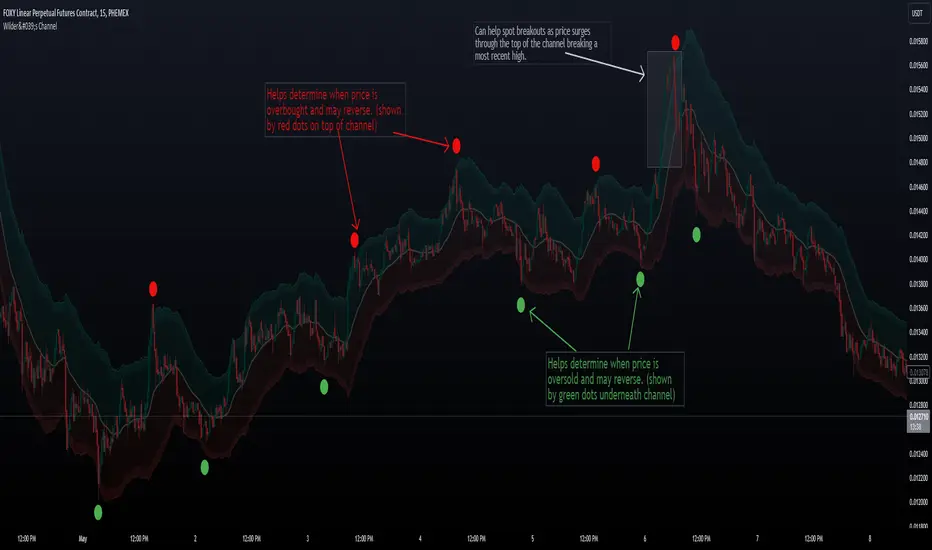
Wilder's Channel

The Wilder’s channel is a typical channel indicator made of 2 Wilder’s average from the high and low price over a “p” period, factorized by the Average True Range value over “atx” period.
Indicator from Kevin Britain library.
"Wilder's Channel," which is plotted on the chart overlay to assist traders in visualizing potential support and resistance levels. This script uses a combination of Wilder's Moving Average and the Average True Range (ATR) to create a channel around price movements. Here's a breakdown of how it works and its benefits:
Trend Confirmation: The channel helps confirm the current trend direction. If prices are consistently near the upper boundary, it suggests an uptrend, and vice versa for a downtrend.
Support and Resistance Levels: The Upper and Lower lines serve as dynamic support and resistance levels, which can help traders identify potential entry and exit points.
Volatility Insight: The width of the channel gives insight into market volatility. A wider channel indicates higher volatility, while a narrower channel suggests less volatility.
Trade Management: The buffer zones can be used for additional decision-making points, such as tightening stop-loss orders or preparing for potential breakouts or pullbacks.
Mã nguồn mở
Theo đúng tinh thần TradingView, tác giả của tập lệnh này đã công bố nó dưới dạng mã nguồn mở, để các nhà giao dịch có thể xem xét và xác minh chức năng. Chúc mừng tác giả! Mặc dù bạn có thể sử dụng miễn phí, hãy nhớ rằng việc công bố lại mã phải tuân theo Nội quy.
Thông báo miễn trừ trách nhiệm
Thông tin và các ấn phẩm này không nhằm mục đích, và không cấu thành, lời khuyên hoặc khuyến nghị về tài chính, đầu tư, giao dịch hay các loại khác do TradingView cung cấp hoặc xác nhận. Đọc thêm tại Điều khoản Sử dụng.