OPEN-SOURCE SCRIPT
Solana – Daily Chart Analysis
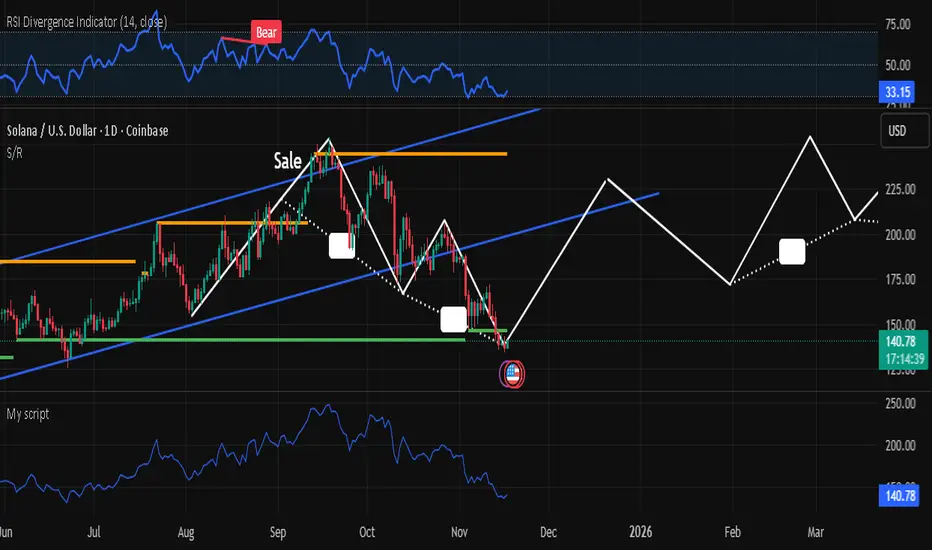
Solana is currently holding around $140 after a sharp correction from the upper channel resistance. Price is testing a key ascending trendline and horizontal support zone near $135.
📉 RSI at 32.76 signals oversold conditions, watch for potential bullish reversal setups.
🔮 Possible Path Ahead (White Projection):
• Bounce to $180 → Consolidation
• Breakout toward $240
• Target zone: $280–$300 by mid-2026
(based on channel re-entry and momentum recovery)
❗If support fails, next major demand zone sits around $100–$110.
📊 Watching closely for confirmation of trend reversal.
Mã nguồn mở
Theo đúng tinh thần TradingView, tác giả của tập lệnh này đã công bố nó dưới dạng mã nguồn mở, để các nhà giao dịch có thể xem xét và xác minh chức năng. Chúc mừng tác giả! Mặc dù bạn có thể sử dụng miễn phí, hãy nhớ rằng việc công bố lại mã phải tuân theo Nội Quy.
Thông báo miễn trừ trách nhiệm
Thông tin và các ấn phẩm này không nhằm mục đích, và không cấu thành, lời khuyên hoặc khuyến nghị về tài chính, đầu tư, giao dịch hay các loại khác do TradingView cung cấp hoặc xác nhận. Đọc thêm tại Điều khoản Sử dụng.