PPSignal System Algorithm
System Algorithm based on historical price probabilities and volumes. We recommend use financial stock, bond, crypts, indices, futures and Forex market (GBPUSD, EURUSD, USDJPY, USDCAD, AUDUSD, USOIL, XAUUSD, SOYUSD, DXY, SPY, SP1!, bitcoin) with defined trends above 50 or 100 and 200 simple moving averages idem if you want trade downtrend financial assets.
Use projections and retracements Fibonacci, MACD and RSI or Stoch oscillator and figures charters Head and shoulder, triangles and double bottom, double top, etc.
This system will notify you of the probability of success. The profit will be defined for yourself and according to your investor profile.
There are stocks and other assets with high returns but the system does not know exactly. Check in the Strategy tester section and then net profit.
We have other tools that support to PPsignal system, we will publish them shortly.
Define system parameters
- As it is a system that is based on past data we recommend using the most historical data weekly (W) but you an use day historical data or 3 o 2 hs.
Candle color: you can choose if you want a trend color for candles or not, in the chart propieties menu detach the border option.
PPsignal it's a very simple system with which you will have a great support when it is a good time for enter in the marker and out.
we await your comments.
Eng. Oscar Alejandro Peruchena
Quants Mathematical and Market Analyst

de igual manera espere antes de entrar al menos 1 o 2 barras.
También se mejoraron los profit en Gráficos de 1H, a 15 Min y 5.
Para gráficos diarios usar configuración (W)
Para Gráficos 1H usar configuración(D)
Para 15 minutos a 5 min (1H o 2H depende del profit porcetable mal alto, VERIFICAR)
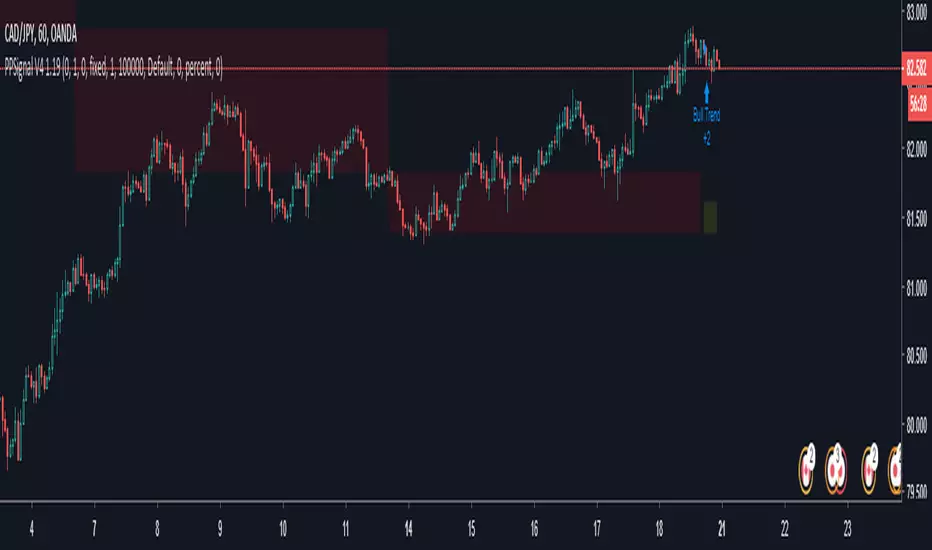
It is this new version we put a filter to avoid sending false of buy or sale signals , which we hope will not appear, TV have a problem with data approximation and sends bad signals before consolidating the final signal.
in the same way wait before entering at least 1 or 2 bars.
Profits were also improved in Graphs of 1H, to 15 Min and 5.
For daily charts use settings (W)
For 1H Graphics use configuration (D)
For 15 minutes to 5 min (1H or 2H depends on the profit percentage wrong, VERIFY)
Gráficos 1H, 240 y diarios Period W y 13. Gráficos 30min a 1H Period 13. Gráficos 1 min a 15 Min period 3H 13.
Usar de guías las escaleras de tendencia.
Apretar F5 en caso de confusión de señales.
Based on the theory of the market movements of Dow and Hamilton, we designed this trend system to identify the waves of each momentum and market slowdown, Dow and Hamilton identified three types of price movements for the Industrial Dow Jones and the train averages: primary movements, secondary movements and daily fluctuations. Primary movements last from a few months to many years and represent the broad underlying trend of the market. Secondary (or reaction) last movements from a few weeks to a few months and move against the primary trend. Daily fluctuations can move with or against the primary trend and last from a few hours to a few days, but usually no more than a week.
bolsawallstreet.com/la-teoria-de-dow/
Graficos de 1 a 15 minutos data 240, de 30 a 3h data semanal
Tập lệnh chỉ hiển thị cho người được mời
Chỉ những người dùng được tác giả chấp thuận mới có thể truy cập tập lệnh này. Bạn sẽ cần yêu cầu và được cấp quyền sử dụng. Thông thường quyền này được cấp sau khi thanh toán. Để biết thêm chi tiết, làm theo hướng dẫn của tác giả bên dưới hoặc liên hệ trực tiếp với PpSignal01.
TradingView KHÔNG khuyến nghị bạn trả phí hoặc sử dụng một tập lệnh trừ khi bạn hoàn toàn tin tưởng vào tác giả và hiểu cách hoạt động của tập lệnh. Bạn cũng có thể tìm các lựa chọn miễn phí, mã nguồn mở trong các script cộng đồng của chúng tôi.
Hướng dẫn của tác giả
Thông báo miễn trừ trách nhiệm
Tập lệnh chỉ hiển thị cho người được mời
Chỉ những người dùng được tác giả chấp thuận mới có thể truy cập tập lệnh này. Bạn sẽ cần yêu cầu và được cấp quyền sử dụng. Thông thường quyền này được cấp sau khi thanh toán. Để biết thêm chi tiết, làm theo hướng dẫn của tác giả bên dưới hoặc liên hệ trực tiếp với PpSignal01.
TradingView KHÔNG khuyến nghị bạn trả phí hoặc sử dụng một tập lệnh trừ khi bạn hoàn toàn tin tưởng vào tác giả và hiểu cách hoạt động của tập lệnh. Bạn cũng có thể tìm các lựa chọn miễn phí, mã nguồn mở trong các script cộng đồng của chúng tôi.