OPEN-SOURCE SCRIPT
Bias TF Table

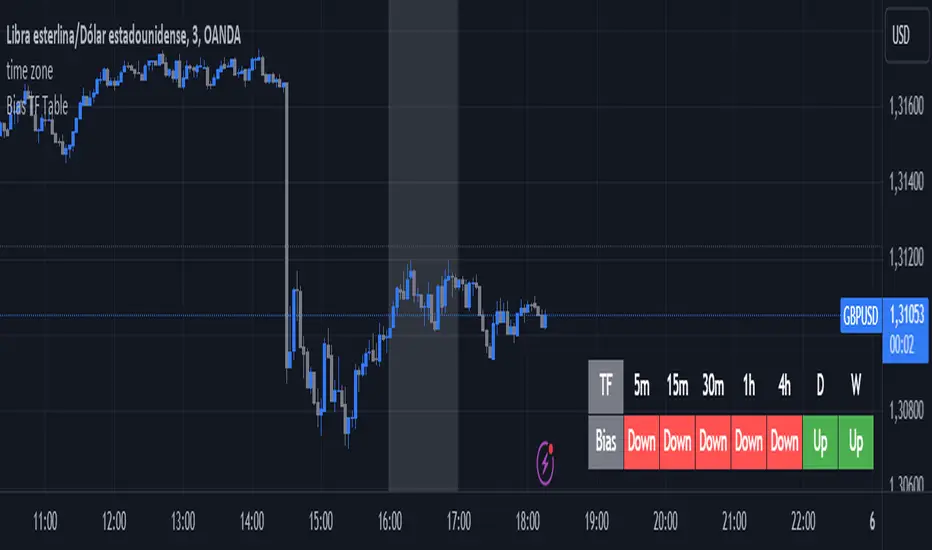
This indicator is a technical analysis tool designed to evaluate the price trend of an asset across multiple time frames (5 minutes, 15 minutes, 30 minutes, 1 hour, 4 hours, daily, and weekly).
Main Functions:
Directional Bias: Displays whether the trend is bullish (Up) or bearish (Down) for each time frame, using the closing price in comparison to a 50-period exponential moving average (EMA).
Table Visualization: Presents the results in a table located in the bottom right corner of the chart, making it easy to read and compare trends across different time intervals.
This indicator provides a quick and effective way to assess market direction and make informed trading decisions based on the trend in various time frames.
Mã nguồn mở
Theo đúng tinh thần TradingView, tác giả của tập lệnh này đã công bố nó dưới dạng mã nguồn mở, để các nhà giao dịch có thể xem xét và xác minh chức năng. Chúc mừng tác giả! Mặc dù bạn có thể sử dụng miễn phí, hãy nhớ rằng việc công bố lại mã phải tuân theo Nội quy.
Thông báo miễn trừ trách nhiệm
Thông tin và các ấn phẩm này không nhằm mục đích, và không cấu thành, lời khuyên hoặc khuyến nghị về tài chính, đầu tư, giao dịch hay các loại khác do TradingView cung cấp hoặc xác nhận. Đọc thêm tại Điều khoản Sử dụng.