OPEN-SOURCE SCRIPT
Cập nhật KST-Based MACD

As a follow-up to my previous script:

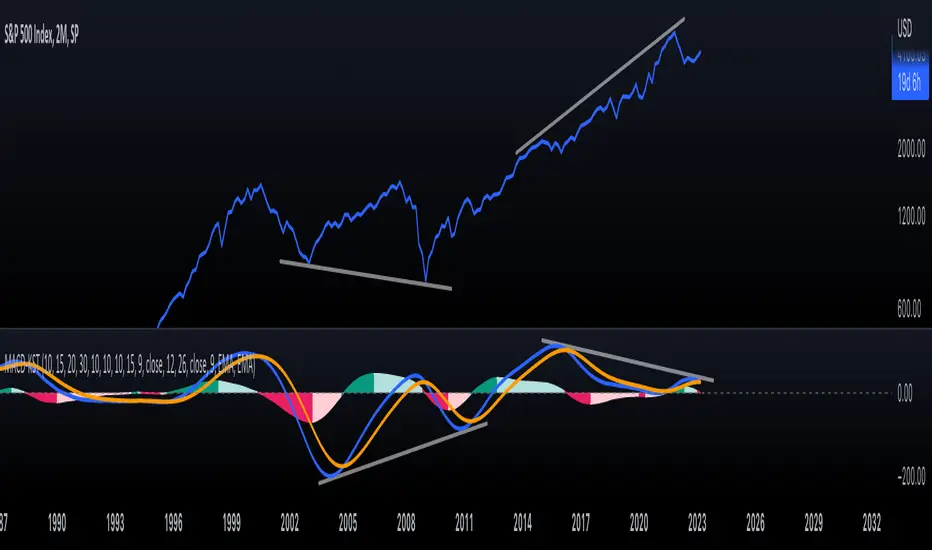
I am posting a stand-alone KST-based MACD.
Note that this indicator is highly laggy. Specific care must be taken when using it.
The MACD-Signal crossing is quite delayed but it is a definite confirmation.
For earlier signs, the Histogram must be analyzed. A shift from Green-White signals the 1st Bear Signal.
A MACD-Signal crossing signals the 2nd Bear SIgnal.
The same applies for bull-signs.
This indicator is useful for long-term charts on which one might want to pinpoint clear, longterm divergences.
Standard RSI, Stochastic RSI and MACD are notoriously problematic when trying to pinpoint long-term divergences.
Finally, this indicator is not meant for pinpointing entry-exit positions. I find it useful for macro analysis. In my experience, the decreased sensitivity of this indicator can show very strong signs, that can be quite laggy.
Inside the indicator there is a setting for "exotic calculations". This is an attempt to make this chart work in both linear/negative charts (T10Y2Y) and log charts (SPX)
Tread lightly, for this is hallowed ground.
-Father Grigori
Phát hành các Ghi chú
Minor code change.Phát hành các Ghi chú
Added a ribbon, I love that stuff...Phát hành các Ghi chú
Aesthetic changes.Phát hành các Ghi chú
Updates in default values to make the indicator more responsive, while keeping it beautiful.Phát hành các Ghi chú
Added copyright. I love that indicator.Phát hành các Ghi chú
Now KST is calculated using EMA by default. This is done for increased sensitivity. You can always revert back to SMA.Mã nguồn mở
Theo đúng tinh thần TradingView, tác giả của tập lệnh này đã công bố nó dưới dạng mã nguồn mở, để các nhà giao dịch có thể xem xét và xác minh chức năng. Chúc mừng tác giả! Mặc dù bạn có thể sử dụng miễn phí, hãy nhớ rằng việc công bố lại mã phải tuân theo Nội quy.
Thông báo miễn trừ trách nhiệm
Thông tin và các ấn phẩm này không nhằm mục đích, và không cấu thành, lời khuyên hoặc khuyến nghị về tài chính, đầu tư, giao dịch hay các loại khác do TradingView cung cấp hoặc xác nhận. Đọc thêm tại Điều khoản Sử dụng.
Mã nguồn mở
Theo đúng tinh thần TradingView, tác giả của tập lệnh này đã công bố nó dưới dạng mã nguồn mở, để các nhà giao dịch có thể xem xét và xác minh chức năng. Chúc mừng tác giả! Mặc dù bạn có thể sử dụng miễn phí, hãy nhớ rằng việc công bố lại mã phải tuân theo Nội quy.
Thông báo miễn trừ trách nhiệm
Thông tin và các ấn phẩm này không nhằm mục đích, và không cấu thành, lời khuyên hoặc khuyến nghị về tài chính, đầu tư, giao dịch hay các loại khác do TradingView cung cấp hoặc xác nhận. Đọc thêm tại Điều khoản Sử dụng.