OPEN-SOURCE SCRIPT
Cập nhật Highest Price Marker
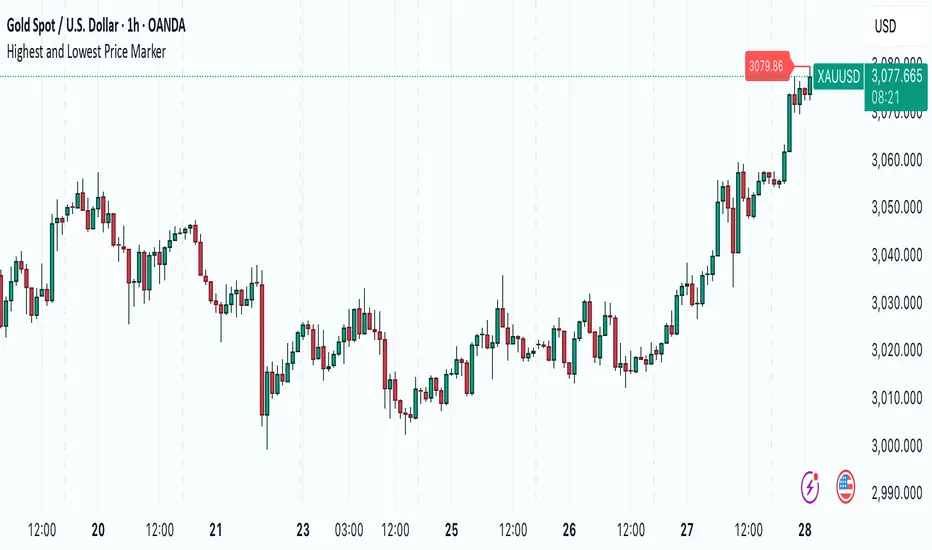
Highest Price Marker – Smart Label & Line Indicator
This Pine Script v5 indicator highlights the highest price reached within the last 100 bars on your chart. It visually enhances key price levels by:
✅ Placing a label at the highest price, positioned 3 candles to the left for clarity.
✅ Drawing a line connecting the label to the actual high for better visibility.
✅ Auto-updating dynamically whenever a new highest price is detected.
This is useful for traders who want to quickly identify resistance levels or analyze historical price peaks without cluttering the chart.
🔹 How to Use:
Add the indicator to your chart.
Look for the red label marking the highest price within the last 100 bars.
The horizontal line helps track the exact price level.
💡 Customization Ideas:
Adjust the lookback period (length = 100) to detect longer or shorter trends.
Modify colors or label positioning to suit your preferences.
🚀 Perfect for:
🔸 Price Action Traders
🔸 Swing & Breakout Traders
🔸 Support & Resistance Analysis
Phát hành các Ghi chú
This indicator scans the past 100 bars to pinpoint the most extreme price levels, marking the highest and lowest values on your chart. It adds dynamic labels and connecting lines that visually capture these key price points, providing you with a clear reference of where significant price movements have occurred over your chosen period.By displaying these price markers in real time, the tool gives you an intuitive snapshot of market extremes, enabling you to better monitor sudden shifts and evaluate market sentiment. Whether you're tracking intraday volatility or analyzing longer-term trends, this indicator serves as a practical guide to the price action that matters most.
Mã nguồn mở
Theo đúng tinh thần TradingView, tác giả của tập lệnh này đã công bố nó dưới dạng mã nguồn mở, để các nhà giao dịch có thể xem xét và xác minh chức năng. Chúc mừng tác giả! Mặc dù bạn có thể sử dụng miễn phí, hãy nhớ rằng việc công bố lại mã phải tuân theo Nội Quy.
Thông báo miễn trừ trách nhiệm
Thông tin và các ấn phẩm này không nhằm mục đích, và không cấu thành, lời khuyên hoặc khuyến nghị về tài chính, đầu tư, giao dịch hay các loại khác do TradingView cung cấp hoặc xác nhận. Đọc thêm tại Điều khoản Sử dụng.