OPEN-SOURCE SCRIPT
FCNC Spread
Title: FCNC Spread Indicator
Description:
The FCNC Spread Indicator is designed to help traders analyze the price difference (spread) between two futures contracts: the front contract and the next contract. This type of analysis is commonly used in futures trading to identify market sentiment, arbitrage opportunities, and potential roll yield strategies.
How It Works:
Front Contract: The front contract represents the futures contract closest to expiration, often referred to as the near-month contract.
Next Contract: The next contract is the futures contract that follows the front contract in the expiration cycle, typically the next available month.
Spread Calculation: frontContract - nextContract represents the difference between the price of the front contract and the next contract.
Positive Spread: A positive value means that the front contract is more expensive than the next contract, indicating backwardation.
Negative Spread: A negative value means that the front contract is cheaper than the next contract, indicating contango.
How to Use:
Input Selection: Select your desired futures contracts for the front and next contract through the input settings. The script will fetch and calculate the closing prices of these contracts.
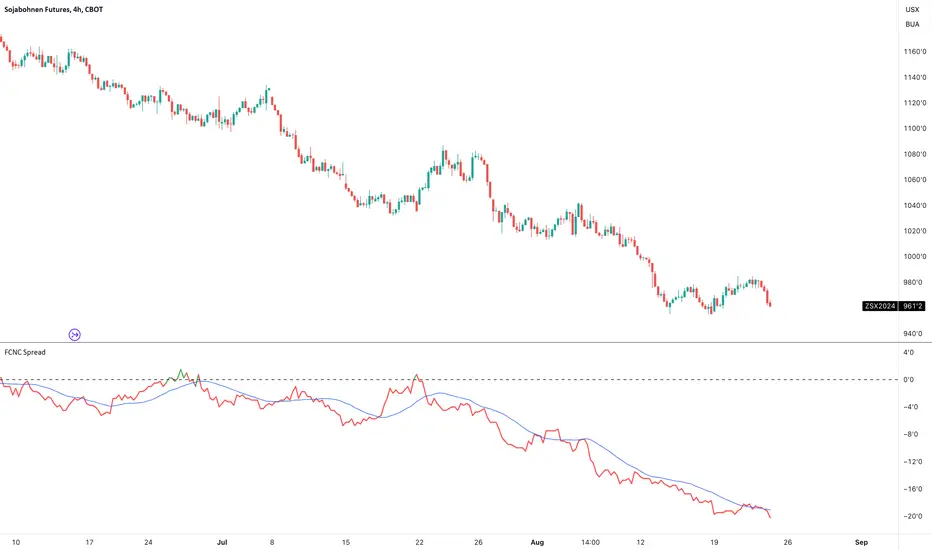
Spread Plotting: The calculated spread is plotted on the chart, with color-coding based on the spread's value (green for positive, red for negative).
Labeling: The spread value is dynamically labeled on the chart for quick reference.
Moving Average: A 20-period Simple Moving Average (SMA) of the spread is also plotted to help identify trends and smooth out fluctuations.
Applications:
Trend Identification: Analyze the spread to determine market sentiment and potential trend reversals.
Divergence Detection: Look for divergences between the spread and the underlying market to identify possible shifts in trend or market sentiment. Divergences can signal upcoming reversals or provide early warning signs of a change in market dynamics.
This indicator is particularly useful for futures traders who are looking to gain insights into the market structure and to exploit differences in contract pricing. By providing a clear visualization of the spread between two key futures contracts, traders can make more informed decisions about their trading strategies.
Description:
The FCNC Spread Indicator is designed to help traders analyze the price difference (spread) between two futures contracts: the front contract and the next contract. This type of analysis is commonly used in futures trading to identify market sentiment, arbitrage opportunities, and potential roll yield strategies.
How It Works:
Front Contract: The front contract represents the futures contract closest to expiration, often referred to as the near-month contract.
Next Contract: The next contract is the futures contract that follows the front contract in the expiration cycle, typically the next available month.
Spread Calculation: frontContract - nextContract represents the difference between the price of the front contract and the next contract.
Positive Spread: A positive value means that the front contract is more expensive than the next contract, indicating backwardation.
Negative Spread: A negative value means that the front contract is cheaper than the next contract, indicating contango.
How to Use:
Input Selection: Select your desired futures contracts for the front and next contract through the input settings. The script will fetch and calculate the closing prices of these contracts.
Spread Plotting: The calculated spread is plotted on the chart, with color-coding based on the spread's value (green for positive, red for negative).
Labeling: The spread value is dynamically labeled on the chart for quick reference.
Moving Average: A 20-period Simple Moving Average (SMA) of the spread is also plotted to help identify trends and smooth out fluctuations.
Applications:
Trend Identification: Analyze the spread to determine market sentiment and potential trend reversals.
Divergence Detection: Look for divergences between the spread and the underlying market to identify possible shifts in trend or market sentiment. Divergences can signal upcoming reversals or provide early warning signs of a change in market dynamics.
This indicator is particularly useful for futures traders who are looking to gain insights into the market structure and to exploit differences in contract pricing. By providing a clear visualization of the spread between two key futures contracts, traders can make more informed decisions about their trading strategies.
Mã nguồn mở
Theo đúng tinh thần TradingView, tác giả của tập lệnh này đã công bố nó dưới dạng mã nguồn mở, để các nhà giao dịch có thể xem xét và xác minh chức năng. Chúc mừng tác giả! Mặc dù bạn có thể sử dụng miễn phí, hãy nhớ rằng việc công bố lại mã phải tuân theo Nội quy.
Thông báo miễn trừ trách nhiệm
Thông tin và các ấn phẩm này không nhằm mục đích, và không cấu thành, lời khuyên hoặc khuyến nghị về tài chính, đầu tư, giao dịch hay các loại khác do TradingView cung cấp hoặc xác nhận. Đọc thêm tại Điều khoản Sử dụng.