OPEN-SOURCE SCRIPT
Triple Gaussian Smoothed Ribbon [BOSWaves]
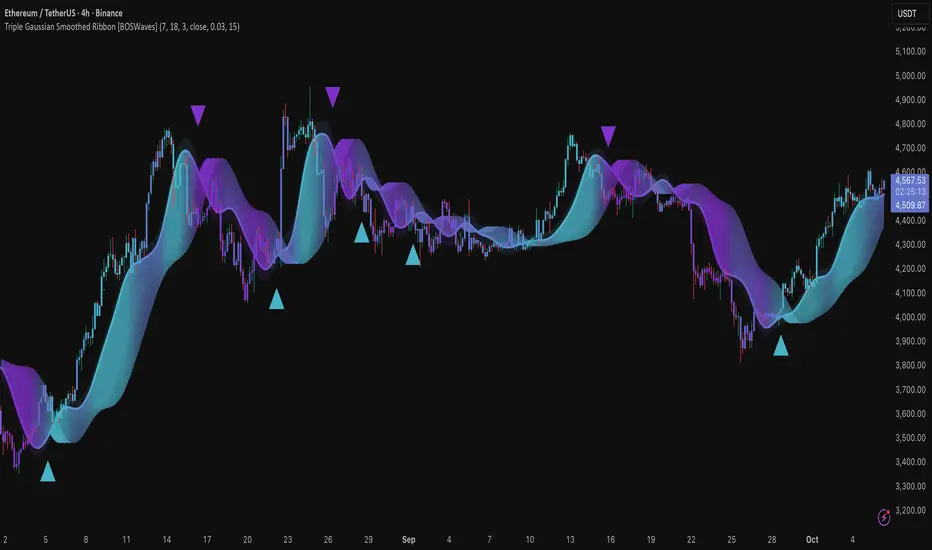
Triple Gaussian Smoothed Ribbon – Adaptive Gaussian Framework
Overview
The Triple Gaussian Smoothed Ribbon is a next-generation market visualization framework built on the principles of Gaussian filtering - a mathematical model from digital signal processing designed to remove noise while preserving the integrity of the underlying trend.

Unlike conventional moving averages that suffer from phase lag and overreaction to volatility spikes, Gaussian smoothing produces a symmetrical, low-lag curve that isolates meaningful directional shifts with exceptional clarity.
Developed under the Adaptive Gaussian Framework, this indicator extends the classical Gaussian model into a multi-stage smoothing and visualization system. By layering three progressive Gaussian filters and rendering their interactions as a gradient-based ribbon field, it translates market energy into a coherent, visually structured trend environment. Each ribbon layer represents a progressively smoothed component of price motion, producing a high-fidelity gradient field that evolves in sync with real-time trend strength and momentum.
The result is a uniquely fluid trend and reversal detection system - one that feels organic, adapts seamlessly across timeframes, and reveals hidden transitions in market structure long before traditional indicators confirm them.
Theoretical Foundation
The Gaussian filter, derived from the Gaussian function developed by Carl Friedrich Gauss in 1809, operates on the principle of weighted symmetry, assigning higher importance to central price data while tapering influence toward historical extremes following a bell-curve distribution. This symmetrical design minimizes phase distortion and smooths without introducing lag spikes — a stark contrast to exponential or linear filters that sacrifice temporal accuracy for responsiveness.
By cascading three Gaussian stages in sequence, the indicator creates a multi-frequency decomposition of price action:
The final composite ribbon reflects the market’s dominant frequency - a smoothed yet reactive trend spine - while an independent, heavier Gaussian smoothing serves as a reference layer to gauge whether the primary motion leads or lags relative to broader market structure.
This multi-layered Gaussian framework effectively replicates the behavior of a signal-processing filter bank: isolating meaningful cyclical movements, suppressing random noise, and revealing phase shifts with minimal delay.
How It Works
Triple Gaussian Core
Price data is passed through three successive Gaussian smoothing stages, each refining the trend further and removing higher-frequency distortions.
The result is a fluid, continuously adaptive baseline that responds naturally to directional changes without overshooting or flattening key inflection points.
Adaptive Ribbon Architecture
The indicator visualizes its internal dynamics through a five-layer gradient ribbon. Each layer represents a progressively delayed Gaussian curve, creating a color field that dynamically shifts between bullish and bearish tones.
The smooth color gradient provides a real-time depiction of energy buildup or dissipation within the trend, making it visually clear when the market is entering a state of expansion, transition, or exhaustion.
Momentum-Weighted Opacity
Ribbon transparency adjusts according to normalized momentum strength.
As trend force builds, colors intensify and layers become more opaque, signifying conviction.
When momentum wanes, ribbons fade - an early visual cue for potential reversals or pauses in trend continuation.
Candle Gradient Integration
Optional candle coloring ties the chart’s candles to the prevailing Gaussian gradient, allowing traders to view raw price action and smoothed wave dynamics as a unified system.
This integration produces a visually coherent chart environment that communicates directional intent instantly.
Signal Detection Logic
Directional cues emerge when the smoother, broader Gaussian curve crosses the faster-reacting Gaussian line, marking structural inflection points in the filtered trend.
To maintain integrity in choppy markets, the framework applies a trend-strength and separation filter, which blocks weak or overlapping conditions where movement lacks conviction.
Interpretation
The Triple Gaussian Smoothed Ribbon provides a layered, intuitive read on market structure:
These transitions mirror the natural ebb and flow of market energy - captured through the Gaussian filter’s ability to represent smooth curvature without distortion.
Strategy Integration
Trend Following
Engage during strong directional expansions. When ribbons widen and color gradients intensify, the trend is accelerating with high confidence.
Reversal Identification
Monitor for full gradient inversion and fading momentum opacity. These conditions often precede transitional phases and early reversals.
Breakout Anticipation
Flat, compressed ribbons signal low volatility and energy buildup. A sudden gradient expansion with renewed opacity confirms breakout initiation.
Multi-Timeframe Alignment
Use higher timeframes to establish directional bias and lower timeframes for entry during compression-to-expansion transitions.
Technical Implementation Details
This structure blends the precision of digital signal processing with the readability of visual market analysis, creating a clean but information-rich framework.
Optimal Application Parameters
Asset Recommendations
Timeframe Recommendations
Performance Characteristics
Most Effective In:
Less Effective In:
Integration Guidelines
Disclaimer
The Triple Gaussian Smoothed Ribbon – Adaptive Gaussian Framework is designed as a signal visualization and trend interpretation tool, not a standalone trading system. Its accuracy depends on appropriate parameter tuning, contextual confirmation, and disciplined risk management. It should be applied as part of a comprehensive technical or algorithmic trading strategy.
Overview
The Triple Gaussian Smoothed Ribbon is a next-generation market visualization framework built on the principles of Gaussian filtering - a mathematical model from digital signal processing designed to remove noise while preserving the integrity of the underlying trend.
Unlike conventional moving averages that suffer from phase lag and overreaction to volatility spikes, Gaussian smoothing produces a symmetrical, low-lag curve that isolates meaningful directional shifts with exceptional clarity.
Developed under the Adaptive Gaussian Framework, this indicator extends the classical Gaussian model into a multi-stage smoothing and visualization system. By layering three progressive Gaussian filters and rendering their interactions as a gradient-based ribbon field, it translates market energy into a coherent, visually structured trend environment. Each ribbon layer represents a progressively smoothed component of price motion, producing a high-fidelity gradient field that evolves in sync with real-time trend strength and momentum.
The result is a uniquely fluid trend and reversal detection system - one that feels organic, adapts seamlessly across timeframes, and reveals hidden transitions in market structure long before traditional indicators confirm them.
Theoretical Foundation
The Gaussian filter, derived from the Gaussian function developed by Carl Friedrich Gauss in 1809, operates on the principle of weighted symmetry, assigning higher importance to central price data while tapering influence toward historical extremes following a bell-curve distribution. This symmetrical design minimizes phase distortion and smooths without introducing lag spikes — a stark contrast to exponential or linear filters that sacrifice temporal accuracy for responsiveness.
By cascading three Gaussian stages in sequence, the indicator creates a multi-frequency decomposition of price action:
- The first stage captures immediate trend transitions.
- The second absorbs mid-term volatility ripples.
- The third stabilizes structural directionality.
The final composite ribbon reflects the market’s dominant frequency - a smoothed yet reactive trend spine - while an independent, heavier Gaussian smoothing serves as a reference layer to gauge whether the primary motion leads or lags relative to broader market structure.
This multi-layered Gaussian framework effectively replicates the behavior of a signal-processing filter bank: isolating meaningful cyclical movements, suppressing random noise, and revealing phase shifts with minimal delay.
How It Works
Triple Gaussian Core
Price data is passed through three successive Gaussian smoothing stages, each refining the trend further and removing higher-frequency distortions.
The result is a fluid, continuously adaptive baseline that responds naturally to directional changes without overshooting or flattening key inflection points.
Adaptive Ribbon Architecture
The indicator visualizes its internal dynamics through a five-layer gradient ribbon. Each layer represents a progressively delayed Gaussian curve, creating a color field that dynamically shifts between bullish and bearish tones.
- Expanding ribbons indicate accelerating momentum and trend conviction.
- Compressing ribbons reflect consolidation and volatility contraction.
The smooth color gradient provides a real-time depiction of energy buildup or dissipation within the trend, making it visually clear when the market is entering a state of expansion, transition, or exhaustion.
Momentum-Weighted Opacity
Ribbon transparency adjusts according to normalized momentum strength.
As trend force builds, colors intensify and layers become more opaque, signifying conviction.
When momentum wanes, ribbons fade - an early visual cue for potential reversals or pauses in trend continuation.
Candle Gradient Integration
Optional candle coloring ties the chart’s candles to the prevailing Gaussian gradient, allowing traders to view raw price action and smoothed wave dynamics as a unified system.
This integration produces a visually coherent chart environment that communicates directional intent instantly.
Signal Detection Logic
Directional cues emerge when the smoother, broader Gaussian curve crosses the faster-reacting Gaussian line, marking structural inflection points in the filtered trend.
- Bullish shifts: short-term momentum transitions upward through the long-term baseline after a localized trough.
- Bearish shifts: momentum declines through the baseline following a local peak.
To maintain integrity in choppy markets, the framework applies a trend-strength and separation filter, which blocks weak or overlapping conditions where movement lacks conviction.
Interpretation
The Triple Gaussian Smoothed Ribbon provides a layered, intuitive read on market structure:
- Trend Continuation: Expanding ribbons with deep color intensity confirm directional strength.
- Reversal Phases: Color gradients flip direction, indicating a phase shift or exhaustion point.
- Compression Zones: Tight, pale ribbons reveal equilibrium phases often preceding breakouts.
- Momentum Divergence: Fading color intensity despite continued price movement signals weakening conviction.
These transitions mirror the natural ebb and flow of market energy - captured through the Gaussian filter’s ability to represent smooth curvature without distortion.
Strategy Integration
Trend Following
Engage during strong directional expansions. When ribbons widen and color gradients intensify, the trend is accelerating with high confidence.
Reversal Identification
Monitor for full gradient inversion and fading momentum opacity. These conditions often precede transitional phases and early reversals.
Breakout Anticipation
Flat, compressed ribbons signal low volatility and energy buildup. A sudden gradient expansion with renewed opacity confirms breakout initiation.
Multi-Timeframe Alignment
Use higher timeframes to establish directional bias and lower timeframes for entry during compression-to-expansion transitions.
Technical Implementation Details
- Triple Gaussian Stack: Sequential smoothing stages produce low-lag, high-purity signals.
- Adaptive Ribbon Rendering: Five-layer Gaussian visualization for gradient-based trend depth.
- Momentum Normalization: Opacity dynamically tied to trend strength and volatility context.
- Consolidation Filter: Suppresses false signals in low-energy or range-bound conditions.
- Integrated Candle Mode: Optional color synchronization with underlying gradient flow.
- Alert System: Built-in notifications for bullish and bearish transitions.
This structure blends the precision of digital signal processing with the readability of visual market analysis, creating a clean but information-rich framework.
Optimal Application Parameters
Asset Recommendations
- Cryptocurrency: Higher smoothing and sigma for stability under volatility.
- Forex: Balanced parameters for cycle identification and reduced noise.
- Equities: Moderate Gaussian length for responsive yet stable trend reads.
- Indices & Futures: Longer smoothing periods for structural confirmation.
Timeframe Recommendations
- Scalping (1 - 5m): Use shorter smoothing for fast reactivity.
- Intraday (15m - 1h): Mid-length Gaussian chain for balance.
- Swing (4h - 1D): Prioritize clarity and opacity-driven trend phases.
- Position (Daily - Weekly): Longer smoothing to capture macro rhythm.
Performance Characteristics
Most Effective In:
- Trending markets with recurring volatility cycles.
- Transitional phases where early directional confirmation is crucial.
Less Effective In:
- Ultra-low volume markets with erratic tick data.
- Random, micro-chop conditions with no structural flow.
Integration Guidelines
- Pair with volatility or volume expansion tools for enhanced breakout confirmation.
- Use ribbon compression to anticipate volatility shifts.
- Align entries with gradient expansion in the dominant color direction.
- Scale position size relative to opacity strength and ribbon width.
Disclaimer
The Triple Gaussian Smoothed Ribbon – Adaptive Gaussian Framework is designed as a signal visualization and trend interpretation tool, not a standalone trading system. Its accuracy depends on appropriate parameter tuning, contextual confirmation, and disciplined risk management. It should be applied as part of a comprehensive technical or algorithmic trading strategy.
Mã nguồn mở
Theo đúng tinh thần TradingView, tác giả của tập lệnh này đã công bố nó dưới dạng mã nguồn mở, để các nhà giao dịch có thể xem xét và xác minh chức năng. Chúc mừng tác giả! Mặc dù bạn có thể sử dụng miễn phí, hãy nhớ rằng việc công bố lại mã phải tuân theo Nội quy.
Thông báo miễn trừ trách nhiệm
Thông tin và các ấn phẩm này không nhằm mục đích, và không cấu thành, lời khuyên hoặc khuyến nghị về tài chính, đầu tư, giao dịch hay các loại khác do TradingView cung cấp hoặc xác nhận. Đọc thêm tại Điều khoản Sử dụng.