OPEN-SOURCE SCRIPT
Metaphor Vigour Ratio
### **Script Name:** Metaphor Vigour Ratio
**Short Title:** Metaphor Vigour Ratio
**Author:** Sovit Manjani, CMT
**Description:**
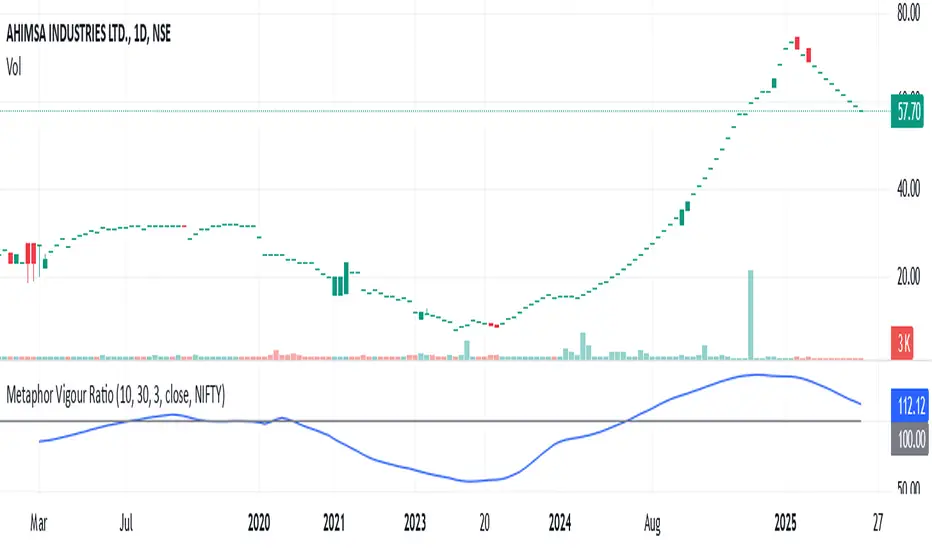
The Metaphor Vigour Ratio (MVRatio) is a powerful Relative Strength Indicator designed for assessing normalized relative strength. It is versatile and can be applied to any script or used to rank symbols based on their intermarket relative strength.
---
### **Features:**
1. **Bullish and Bearish Signals:**
- **Above 100:** Indicates a bullish trend.
- **Below 100:** Indicates a bearish trend.
2. **Trend Analysis with Slope:**
- **Slope Rising:** Suggests bullish momentum.
- **Slope Falling:** Suggests bearish momentum.
3. **Stock Selection Strategy:**
- Identify and rank stocks based on the MVRatio. For example, buy the top 10 stocks of Nifty with the highest MVRatio values for strong performance potential.
---
### **Inputs:**
1. **Fast EMA Period (RSEMAFast):** Default set to 10. Controls the sensitivity of the Fast Moving Average.
2. **Slow EMA Period (RSEMASlow):** Default set to 30. Provides a stable trend base with the Slow Moving Average.
3. **Smooth EMA Period (SmoothEMA):** Default set to 3. Smooths the MVRatio for better clarity.
4. **Close Source:** Default is the closing price, but it can be customized as needed.
5. **Comparative Symbol (ComparativeTickerId):** Default is "NSE:NIFTY," allowing comparison against a benchmark index.
---
### **Calculation Logic:**
1. **Relative Strength (RS):**
- Calculated as the ratio of the base symbol's price to the comparative symbol's price.
2. **Exponential Moving Averages (FastMA and SlowMA):**
- Applied to the RS to smooth and differentiate trends.
3. **Metaphor Vigour Ratio (MVRatio):**
- Computed as the ratio of FastMA to SlowMA, scaled by 100, and further smoothed using SmoothEMA.
---
### **Visualization:**
1. **MVRatio Plot (Blue):**
- Represents the relative strength dynamics.
2. **Reference Line at 100 (Gray):**
- Helps quickly identify bullish (above 100) and bearish (below 100) zones.
---
### **How to Use:**
1. Add the indicator to your chart from TradingView's Pine Script editor.
2. Compare the performance of any symbol relative to a benchmark (e.g., Nifty).
3. Analyze trends, slopes, and ranking based on MVRatio values to make informed trading decisions.
---
**Note:** This indicator is for educational purposes and should be used alongside other analysis methods to make trading decisions.
**Short Title:** Metaphor Vigour Ratio
**Author:** Sovit Manjani, CMT
**Description:**
The Metaphor Vigour Ratio (MVRatio) is a powerful Relative Strength Indicator designed for assessing normalized relative strength. It is versatile and can be applied to any script or used to rank symbols based on their intermarket relative strength.
---
### **Features:**
1. **Bullish and Bearish Signals:**
- **Above 100:** Indicates a bullish trend.
- **Below 100:** Indicates a bearish trend.
2. **Trend Analysis with Slope:**
- **Slope Rising:** Suggests bullish momentum.
- **Slope Falling:** Suggests bearish momentum.
3. **Stock Selection Strategy:**
- Identify and rank stocks based on the MVRatio. For example, buy the top 10 stocks of Nifty with the highest MVRatio values for strong performance potential.
---
### **Inputs:**
1. **Fast EMA Period (RSEMAFast):** Default set to 10. Controls the sensitivity of the Fast Moving Average.
2. **Slow EMA Period (RSEMASlow):** Default set to 30. Provides a stable trend base with the Slow Moving Average.
3. **Smooth EMA Period (SmoothEMA):** Default set to 3. Smooths the MVRatio for better clarity.
4. **Close Source:** Default is the closing price, but it can be customized as needed.
5. **Comparative Symbol (ComparativeTickerId):** Default is "NSE:NIFTY," allowing comparison against a benchmark index.
---
### **Calculation Logic:**
1. **Relative Strength (RS):**
- Calculated as the ratio of the base symbol's price to the comparative symbol's price.
2. **Exponential Moving Averages (FastMA and SlowMA):**
- Applied to the RS to smooth and differentiate trends.
3. **Metaphor Vigour Ratio (MVRatio):**
- Computed as the ratio of FastMA to SlowMA, scaled by 100, and further smoothed using SmoothEMA.
---
### **Visualization:**
1. **MVRatio Plot (Blue):**
- Represents the relative strength dynamics.
2. **Reference Line at 100 (Gray):**
- Helps quickly identify bullish (above 100) and bearish (below 100) zones.
---
### **How to Use:**
1. Add the indicator to your chart from TradingView's Pine Script editor.
2. Compare the performance of any symbol relative to a benchmark (e.g., Nifty).
3. Analyze trends, slopes, and ranking based on MVRatio values to make informed trading decisions.
---
**Note:** This indicator is for educational purposes and should be used alongside other analysis methods to make trading decisions.
Mã nguồn mở
Theo đúng tinh thần TradingView, tác giả của tập lệnh này đã công bố nó dưới dạng mã nguồn mở, để các nhà giao dịch có thể xem xét và xác minh chức năng. Chúc mừng tác giả! Mặc dù bạn có thể sử dụng miễn phí, hãy nhớ rằng việc công bố lại mã phải tuân theo Nội Quy.
Thông báo miễn trừ trách nhiệm
Thông tin và các ấn phẩm này không nhằm mục đích, và không cấu thành, lời khuyên hoặc khuyến nghị về tài chính, đầu tư, giao dịch hay các loại khác do TradingView cung cấp hoặc xác nhận. Đọc thêm tại Điều khoản Sử dụng.