OPEN-SOURCE SCRIPT
Cập nhật Previous Day & Week Highs and Lows
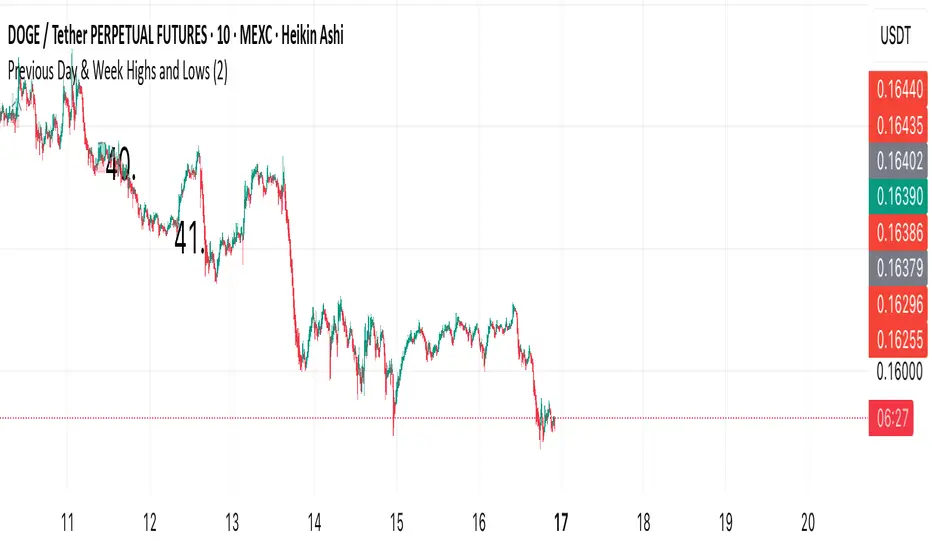
Overlay indicator that plots horizontal lines for the previous day’s and previous week’s highs and lows. Lines extend until the next period starts, so you can see these levels throughout the current day or week.
The indicator detects new daily and weekly sessions and draws lines at the previous period’s high and low. Daily levels use green (high) and red (low); weekly levels use blue (high) and magenta (low). You can toggle daily/weekly independently, customize colors, and adjust line width. It works on intraday timeframes and helps identify support/resistance and track breakouts relative to prior periods.
The indicator detects new daily and weekly sessions and draws lines at the previous period’s high and low. Daily levels use green (high) and red (low); weekly levels use blue (high) and magenta (low). You can toggle daily/weekly independently, customize colors, and adjust line width. It works on intraday timeframes and helps identify support/resistance and track breakouts relative to prior periods.
Phát hành các Ghi chú
Overlay indicator that plots horizontal lines for the previous day’s and previous week’s highs and lows. Lines extend until the next period starts, so you can see these levels throughout the current day or week.The indicator detects new daily and weekly sessions and draws lines at the previous period’s high and low. Daily levels use green (high) and red (low); weekly levels use blue (high) and magenta (low). You can toggle daily/weekly independently, customize colors, and adjust line width. It works on intraday timeframes and helps identify support/resistance and track breakouts relative to prior periods.
Mã nguồn mở
Theo đúng tinh thần TradingView, tác giả của tập lệnh này đã công bố nó dưới dạng mã nguồn mở, để các nhà giao dịch có thể xem xét và xác minh chức năng. Chúc mừng tác giả! Mặc dù bạn có thể sử dụng miễn phí, hãy nhớ rằng việc công bố lại mã phải tuân theo Nội quy.
Thông báo miễn trừ trách nhiệm
Thông tin và các ấn phẩm này không nhằm mục đích, và không cấu thành, lời khuyên hoặc khuyến nghị về tài chính, đầu tư, giao dịch hay các loại khác do TradingView cung cấp hoặc xác nhận. Đọc thêm tại Điều khoản Sử dụng.