OPEN-SOURCE SCRIPT
Cập nhật PB SAR BackTest - Colorbar
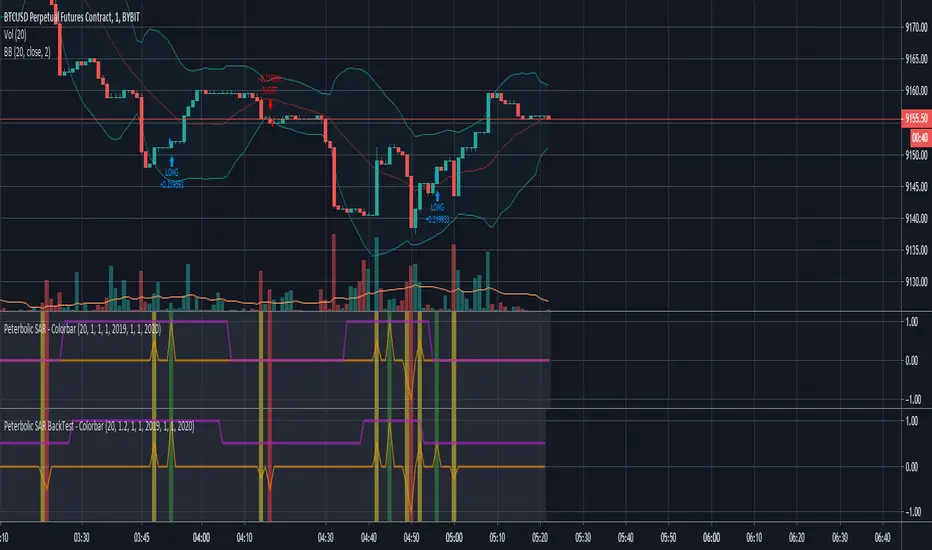
Indicator with buy/sell alerts for setup/trigger conditions
Built upon Peterbolic SAR current version as of publishing
Built upon Peterbolic SAR current version as of publishing
Phát hành các Ghi chú
Forgot you have to manually calculate the Heiken Ashi candle values to get the proper signals on normal candles for this onePhát hành các Ghi chú
Improved the way the script calculates the plot and what colors to useFixed the alerts to use the original signals that the plot is draw from so no mishaps occur (Pine script and/or Tradingview can get touchy about how you set your alert conditions)
Added a blue indicator line for if we're considered in an uptrend or not based on the current indicator levels
You can usually tell based on the previous values/colors but it's easier to spot immediately at any point when viewing a chart
Phát hành các Ghi chú
Add option to use Heiken Ashi values (or not) instead of hard setting them, results can vary depending on different time frames and this should help with more strategiesPhát hành các Ghi chú
AS AN EXAMPLE YOU CAN RUN FOR YOURSELF:BTCUSD
Comparison: 1D and 12H
Flip Heiken Ashi values on and off for both and compare
1D is profitable using HA, but 12H is MUCH more profitable using normal values instead (like 3-4x more)
Comparison: 1m
Flip Heiken Ashi values on and off
HA makes scalping less profitable, but smooths things out so there are less trades and potentially less fees depending on where you're trading
(Usually HA has 60% of the trade count compared to using normal candles)
Phát hành các Ghi chú
Added offset for limit order placement target based on BBand average between top and bottomMultiplier = 2
Lookback = 20 (default, can be changed)
Offset = (Top - Bottom) / Lookback / Multiplier
Ex:
Top: 10,000
Bottom: 9,000
Lookback: 20
25 = (10,000 - 9,000 ) / 20 / 2
Limit order price = CURRENT + 25
That example would theoretically be a pump or just a high TF if the BBands are that wide
This should give a reasonable entry point based on the TF or current market volatility
WHY? To make your order more likely to get hit and prevent slippage while not getting dinged for fees by using market orders!
In case you're asking, "Why might you not want to use market orders?"
A quote from our large friend Coinbase
"Coinbase Pro is beloved by many for its incredibly low fees, ranging from 0.1% to 0.25% for taker trades, and no fees at all for maker trades."
"Taker" means you're market ordering to take liquidity
"Maker" means you're limit ordering to provide liquidity
If you can take 0% fees on all your trades instead of 0.1% on EVERY trade you make, it's almost a no brainer.
(Some exchanges even do NEGATIVE fees on maker trades which means they PAY you to use limit orders and provide them liquidity!!!!!)
I would also recommend using the same BBand calculation performed above as an order point for other strategies, it can work quite well on many things
Credit for the BBand calculations goes to Noldo:

Phát hành các Ghi chú
Added Bolinger Band Normalizer value to increase/reduce the offset of order placement based on the volatility at that point in time.Changed the blue line to purple and multiplied it with the BBand Average value to give a visual representation of how much volatility is going on inside the indicator.
The spikes on the orange line will also be larger when the volatility is higher in the same way the purple line does
Phát hành các Ghi chú
Whoops, forgot to fix the backtesting offset for entry/exit values based on the normalized BBand averagePhát hành các Ghi chú
Offset was not calculating as needed due to round() going to 0 for all values <0.5Setup so 0.5 should be the default offset from a setup that hits a trigger, because trigger candles have to EXCEED the setup candles in the direction of the trend
Mã nguồn mở
Theo đúng tinh thần TradingView, tác giả của tập lệnh này đã công bố nó dưới dạng mã nguồn mở, để các nhà giao dịch có thể xem xét và xác minh chức năng. Chúc mừng tác giả! Mặc dù bạn có thể sử dụng miễn phí, hãy nhớ rằng việc công bố lại mã phải tuân theo Nội quy.
Thông báo miễn trừ trách nhiệm
Thông tin và các ấn phẩm này không nhằm mục đích, và không cấu thành, lời khuyên hoặc khuyến nghị về tài chính, đầu tư, giao dịch hay các loại khác do TradingView cung cấp hoặc xác nhận. Đọc thêm tại Điều khoản Sử dụng.