OPEN-SOURCE SCRIPT
Just Another RSI
This is slightly different implementation of RSI using arrays. But, it also comes with a twist.
Formula for standard RSI can be found here: investopedia.com/terms/r/rsi.asp
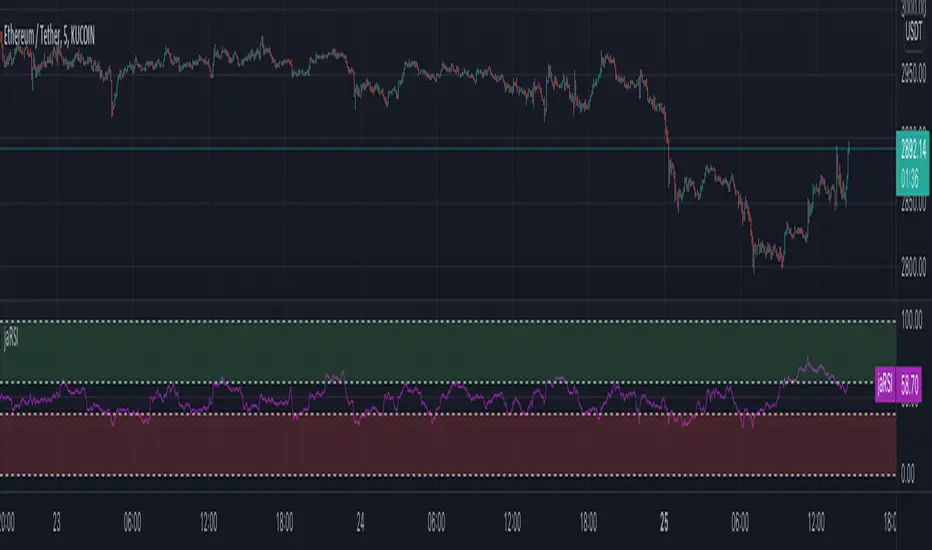
https://www.tradingview.com/x/cWTAH192/
If there is green candle, gain for the candle is equal to price movement from previous bar and loss for that candle is 0. Similarly in case of red candle, loss is considered to be movement from previous candle whereas gain is 0. Also, as mentioned in step2, on each bar, average of previous bar gains/losses are merged with present candle gain/loss.
New Process
How it is different
Since, gain and loss are only considered if there are gain and loss, this index represents the strength between bullish and bearish candles without looking at price movement. Hence, the index has capability to go in opposite direction of the price representing price movement is not supported by strength.
Another advantage of this implementation is it allows using variable length for the method. In case of RSI, length has to be constant. It cannot be variable which can change every bar. But, we do not have that constraint in this implementation due to use of arrays.
At present, this is purely experimental. I will look forward to study this more with respect to divergence and for use in trend following methods.
Formula for standard RSI can be found here: investopedia.com/terms/r/rsi.asp
https://www.tradingview.com/x/cWTAH192/
If there is green candle, gain for the candle is equal to price movement from previous bar and loss for that candle is 0. Similarly in case of red candle, loss is considered to be movement from previous candle whereas gain is 0. Also, as mentioned in step2, on each bar, average of previous bar gains/losses are merged with present candle gain/loss.
New Process
- Gain is considered only on green candles. Hence, there is no zero gain candles
- Loss is considered only on red candles. Hence, there is no zero loss candles
- Average or median of last N gains and losses are considered. Hence, the movement mainly tell us the strength between bullish and bearish candles.
- Let us forget about seeing it as overbought and oversold area and look at it as bullish and bearish region.
How it is different
Since, gain and loss are only considered if there are gain and loss, this index represents the strength between bullish and bearish candles without looking at price movement. Hence, the index has capability to go in opposite direction of the price representing price movement is not supported by strength.
Another advantage of this implementation is it allows using variable length for the method. In case of RSI, length has to be constant. It cannot be variable which can change every bar. But, we do not have that constraint in this implementation due to use of arrays.
At present, this is purely experimental. I will look forward to study this more with respect to divergence and for use in trend following methods.
Mã nguồn mở
Theo đúng tinh thần TradingView, tác giả của tập lệnh này đã công bố nó dưới dạng mã nguồn mở, để các nhà giao dịch có thể xem xét và xác minh chức năng. Chúc mừng tác giả! Mặc dù bạn có thể sử dụng miễn phí, hãy nhớ rằng việc công bố lại mã phải tuân theo Nội quy.
Trial - trendoscope.io/trial
Subscribe - trendoscope.io/pricing
Blog - docs.trendoscope.io
Subscribe - trendoscope.io/pricing
Blog - docs.trendoscope.io
Thông báo miễn trừ trách nhiệm
Thông tin và các ấn phẩm này không nhằm mục đích, và không cấu thành, lời khuyên hoặc khuyến nghị về tài chính, đầu tư, giao dịch hay các loại khác do TradingView cung cấp hoặc xác nhận. Đọc thêm tại Điều khoản Sử dụng.