OPEN-SOURCE SCRIPT
Dynamic 50% Indicator of the selected range!
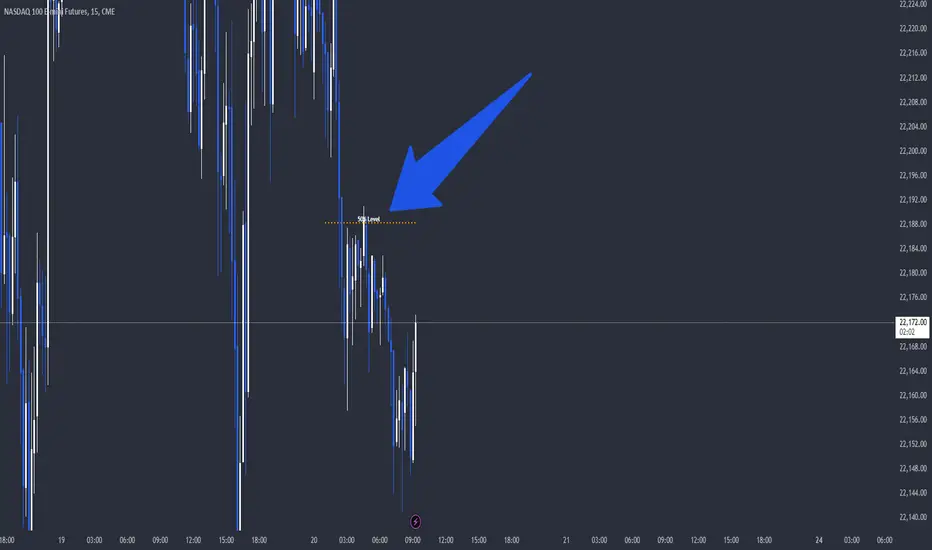
This is a indicator which shows you the 50% level of the selected timeframe range. This is a good tool because price tends to bounce of of 50% levels.
Introducing the 50% Range Level Indicator, designed for traders who seek accuracy and strategic insights in their market analysis. This tool calculates and visually displays the midpoint (50% level) of any selected price range, helping you identify key equilibrium zones where price action often reacts.
Why Use This Indicator?
Key Market Equilibrium – The 50% level is a crucial reference point where price often consolidates, reverses, or gathers momentum.
Custom Range Selection – Simply select your desired price range, and the indicator will dynamically plot the midpoint.
Enhance Your Trading Strategy – Use it for support & resistance confirmation, retracement analysis, or confluence with other indicators.
Works on All Timeframes & Assets – Suitable for stocks, forex, crypto, and indices.
Gain an Edge in the Market
Whether you’re a day trader, swing trader, or long-term investor, the 50% Range Level Indicator can enhance your technical analysis and decision-making.
Mã nguồn mở
Theo đúng tinh thần TradingView, tác giả của tập lệnh này đã công bố nó dưới dạng mã nguồn mở, để các nhà giao dịch có thể xem xét và xác minh chức năng. Chúc mừng tác giả! Mặc dù bạn có thể sử dụng miễn phí, hãy nhớ rằng việc công bố lại mã phải tuân theo Nội quy.
Thông báo miễn trừ trách nhiệm
Thông tin và các ấn phẩm này không nhằm mục đích, và không cấu thành, lời khuyên hoặc khuyến nghị về tài chính, đầu tư, giao dịch hay các loại khác do TradingView cung cấp hoặc xác nhận. Đọc thêm tại Điều khoản Sử dụng.