OPEN-SOURCE SCRIPT
25 Day and 125 Day EMA Trend Indicator
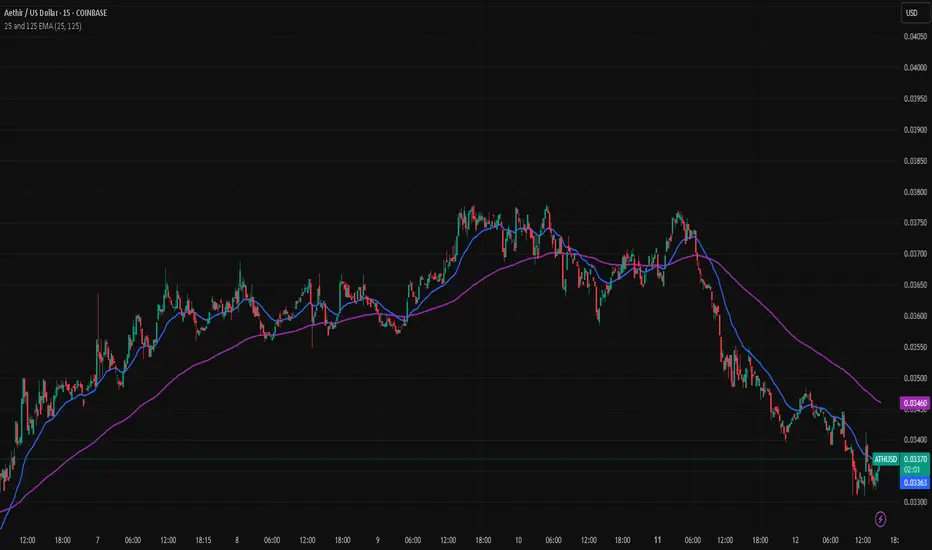
The "25 and 125 EMA Trend indicator," is a powerful yet simple tool designed for use on any TradingView chart. Its primary purpose is to help traders visually identify both short-term and long-term trends in the market.
How the Script Works
The script is built around two Exponential Moving Averages (EMAs), which are a type of moving average that gives more weight to recent price data. This makes them more responsive to current market changes than a Simple Moving Average (SMA). The two EMAs are:
Trading Signals and Interpretation
The real value of this script comes from observing the relationship between the two EMA lines.
Customisation
The script includes user-friendly input fields that allow you to customise the lengths of both EMAs directly from the indicator's settings on the chart. This lets you experiment with different time frames and tailor the indicator to your specific trading strategy.
How the Script Works
The script is built around two Exponential Moving Averages (EMAs), which are a type of moving average that gives more weight to recent price data. This makes them more responsive to current market changes than a Simple Moving Average (SMA). The two EMAs are:
- Fast EMA (25-day): Represented by the blue line, this EMA reacts quickly to price fluctuations. It's excellent for identifying the current short-term direction and momentum of the asset.
- Slow EMA (125-day): Represented by the purple line, this EMA smooths out price action over a much longer period. It's used to determine the underlying, long-term trend of the market.
Trading Signals and Interpretation
The real value of this script comes from observing the relationship between the two EMA lines.
- Uptrend: When the blue (25-day) EMA is above the purple (125-day) EMA, it indicates that the short-term trend is stronger than the long-term trend, signaling a bullish or upward-moving market.
- Downtrend: Conversely, when the blue EMA is below the purple EMA, it suggests that the short-term trend is weaker, indicating a bearish or downward-moving market.
- Cross-overs: The most important signals are often generated when the two lines cross.
- A bullish cross (or "golden cross") occurs when the blue EMA crosses above the purple EMA. This can be a signal that a new, strong uptrend is beginning.
- A bearish cross (or "death cross") occurs when the blue EMA crosses below the purple EMA. This may signal the start of a new downtrend.
Customisation
The script includes user-friendly input fields that allow you to customise the lengths of both EMAs directly from the indicator's settings on the chart. This lets you experiment with different time frames and tailor the indicator to your specific trading strategy.
Mã nguồn mở
Theo đúng tinh thần TradingView, tác giả của tập lệnh này đã công bố nó dưới dạng mã nguồn mở, để các nhà giao dịch có thể xem xét và xác minh chức năng. Chúc mừng tác giả! Mặc dù bạn có thể sử dụng miễn phí, hãy nhớ rằng việc công bố lại mã phải tuân theo Nội quy.
Thông báo miễn trừ trách nhiệm
Thông tin và các ấn phẩm này không nhằm mục đích, và không cấu thành, lời khuyên hoặc khuyến nghị về tài chính, đầu tư, giao dịch hay các loại khác do TradingView cung cấp hoặc xác nhận. Đọc thêm tại Điều khoản Sử dụng.